(eccv) Package eccv Warning: Package ‘hyperref’ is loaded with option ‘pagebackref’, which is *not* recommended for camera-ready version
11email: firstname.lastname@epfl.ch22institutetext: Valeo.ai, France,
33institutetext: Sorbonne Université, France
UniTraj: A Unified Framework for Scalable Vehicle Trajectory Prediction
Abstract
Vehicle trajectory prediction has increasingly relied on data-driven solutions, but their ability to scale to different data domains and the impact of larger dataset sizes on their generalization remain under-explored. While these questions can be studied by employing multiple datasets, it is challenging due to several discrepancies, e.g., in data formats, map resolution, and semantic annotation types. To address these challenges, we introduce UniTraj, a comprehensive framework that unifies various datasets, models, and evaluation criteria, presenting new opportunities for the vehicle trajectory prediction field. In particular, using UniTraj, we conduct extensive experiments and find that model performance significantly drops when transferred to other datasets. However, enlarging data size and diversity can substantially improve performance, leading to a new state-of-the-art result for the nuScenes dataset. We provide insights into dataset characteristics to explain these findings. The code can be found here: https://github.com/vita-epfl/UniTraj.
Keywords:
Vehicle trajectory prediction Multi-dataset framework Domain generalization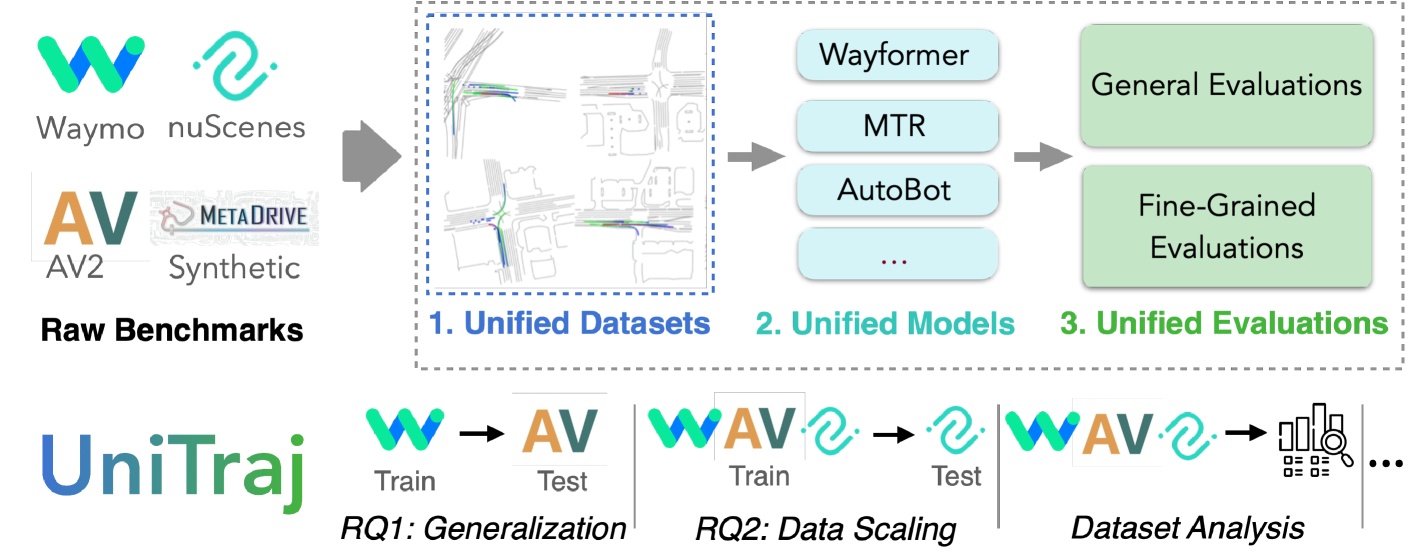
1 Introduction
Predicting the trajectories of surrounding vehicles is essential for ensuring the safety and collision avoidance of autonomous driving systems. With the advent of deep learning, researchers have turned to data-driven solutions to tackle this prediction task. However, while these models can achieve high accuracy, they are heavily reliant on the specific data domain used for training.
An autonomous driving system may encounter various situations such as diverse geographical locations. These various situations introduce data domain shifts, which can significantly impact the performance of the prediction models. Consequently, it is essential to study the performance of the models across diverse domains, such as datasets and cities. However, despite the importance of the question, the generalization of models to different domains has not been adequately studied yet. Therefore, our first Research Question (RQ1) is to investigate the performance drop of trajectory prediction models when transferred to new domains.
A potential solution to improve the generalization ability of prediction models is to scale up the sizes of the datasets to cover a broader spectrum of driving scenarios. While there is a trend in extending datasets’ sizes [10, 14, 8, 50], the impact of dataset size on the performance of trajectory prediction models remains largely unexplored. Our second research question (RQ2) is then to study the impact of increasing dataset sizes on the performance of the prediction models.
Exploring these two research questions involves leveraging multiple trajectory prediction datasets. Firstly, these datasets provide diverse domains, allowing for a thorough examination of model generalization across different domains (RQ1). Secondly, combining these datasets creates a much larger dataset, enabling an exploration of the asymptotic limits of data scaling (RQ2). However, significant challenges exist when attempting to leverage multiple datasets. (1) Each of these datasets has a unique data format, posing practical difficulties for researchers utilizing multiple datasets. (2) Each of the datasets undergoes collection and annotation through distinct strategies, with semi-automatic pre-annotations and manual curations [7, 14, 8]. This leads to multiple discrepancies such as variations in resolution, sampling rates, and types of semantic annotations. (3) Comparing model performance across datasets is not straightforward due to varying dataset settings (e.g., prediction horizons) and evaluation metrics (e.g., mAP metric is used in WOMD [14] and brier-FDE metric in Argoverse 2 [50]). In short, while each of the datasets contributes to the progress in the field, they have been developed independently, without considering harmonization with existing ones. As a result, many trajectory prediction studies train and evaluate their models using a single dataset [13, 31, 2, 9, 46, 3, 37, 20, 22, 5].
To tackle these challenges, we introduce ‘UniTraj’, a comprehensive vehicle trajectory prediction framework. UniTraj seamlessly integrates and unifies multiple data sources (including nuScenes [7], Argoverse 2 [50] and Waymo Open Motion Dataset - WOMD [14]), models (including AutoBot [17], MTR [46], and Wayformer [35]), and evaluations. UniTraj not only serves as a solution to tackle our research questions but also provides a comprehensive and flexible platform for the community. First, it is designed for the effortless inclusion of new datasets by proposing a unified data structure compatible with various datasets. Second, Unitraj supports and simplifies the integration of new methods by providing numerous essential data processing and loss functions relevant to the trajectory prediction task. Lastly, UniTraj offers unified evaluation metrics, as well as diverse and insightful evaluation approaches, such as analyzing performance on the long-tail data instances as well as different clusters of data samples to allow a more in-depth understanding of model behavior. Figure 1 shows the overview of the framework.
We conduct extensive experiments using the UniTraj framework to shed light on our two research questions. Our findings reveal a large performance drop when transitioning between data sources, alongside variations in the generalization abilities induced by different datasets (RQ1). We also show that scaling up dataset size and diversity can enhance model performance significantly without any architectural modifications, leading us to rank st in the nuScenes public leaderboard. This is accomplished by training models on all existing datasets in the framework. This unified dataset forms the largest public data one can use to train a vehicle trajectory prediction model, with more than M samples, hours of data, and different cities. Finally, by providing an in-depth analysis of the datasets, we offer a more comprehensive understanding of their characteristics. Our analysis reveals that the datasets’ generalization capabilities are not only attributed to their size, but also their intrinsic diversity. We believe that the framework opens up new opportunities in the trajectory prediction field, and we will release the framework to foster further advancements. In summary, our contributions are as follows:
-
•
We introduce UniTraj, a comprehensive open-source framework for vehicle trajectory prediction, integrating various datasets, models, and evaluations. It offers a unified platform for comprehensive research in this field.
-
•
We investigate models’ generalization across different datasets and cities and provide insight into the characteristics of datasets on which models acquire better generalization capacities.
-
•
We explore the data scaling impact on model performance employing the largest collection of datasets currently available, and establish a new state-of-the-art model on the nuScenes dataset.
-
•
Finally, we provide an in-depth comparative analysis of the datasets, shedding light on our experimental findings.
2 Previous work
Trajectory prediction datasets. Many academic and industrial laboratories have paved the way for research development by open-sourcing real-world driving datasets [38, 55, 6, 14, 7, 10, 19, 34, 8, 50]. Notably, Argoverse [10] was among the pioneers in releasing the lane graph information, nuScenes [7] expanded the variety of scenes, Waymo [14] enriched their dataset with fine-grained information, and recently, Argoverse 2 [50] released the largest data in terms of unique roadways. While these datasets contribute to field developments, they have been developed in isolation without considering harmonization with former datasets. Thus, there exist multiple challenges in combining them due to various incompatibilities. This work addresses the challenges through a unified framework.
Trajectory prediction benchmarks. Multi-dataset benchmarks have already been explored in various domains such as object detection [57], semantic segmentation [24, 45] and action recognition [30]. In the field of trajectory prediction, such benchmarks have primarily been developed for human trajectory prediction [40, 1, 39]. Notably, Trajnet++ [26] provides an interaction-centric benchmark by categorizing trajectories based on the presence of an interaction. trajdata [21] is a unified interface to multiple human trajectory datasets incorporating scene context into the inputs. A related work for the vehicle trajectory planning task is ScenarioNet [28], a simulator aggregating multiple real-world datasets into a unified format and providing a planning development and evaluation framework. We leverage their data conversion to process datasets. To the best of our knowledge, we are the first to propose an open-source framework for vehicle trajectory prediction. Our framework is not limited to including multiple datasets; it also integrates a variety of trajectory prediction models and evaluation methodologies, thereby providing a comprehensive resource for advancing research and development in the vehicle trajectory prediction task.
Generalization of trajectory prediction models. The discrepancies in data formats in vehicle trajectory prediction datasets hinder research on cross-dataset generalization, leading to limited studies in this area. In [53], one dataset is divided into different domains to explore model generalization. Authors in [44] propose an epistemic uncertainty estimation approach and perform cross-dataset evaluation. In [16], the authors studied cross-dataset generalization of models and showed a performance gap between datasets. However, they provide limited insights into the sources of the generalization gap. Moreover, their code is not publicly available. Previous works also investigated some generalization aspects of trajectory prediction models when they deal with new scenes and cities [11, 27, 32], new agent types [27], using perception outputs instead of curated annotations [49, 56, 51], and facing adversarial situations [3, 41]. In this work, we conduct more extensive and in-depth cross-dataset, and cross-city analyses as well as multi-dataset training. Moreover, we provide insights into the dataset characteristics, explaining the findings. We also release an open-source framework to facilitate this line of research.
3 UniTraj framework
The UniTraj framework, illustrated in Figure 1, consists of three main components. The first component unifies the format and features of various datasets (see Section 3.1). The second component adapts trajectory prediction models to the unified data format, facilitating their training (see Section 3.2). The final component consists of a comprehensive and shared evaluation process for the models (see Section 3.3). The integration of the components allows for diverse experimentation, such as cross-dataset training, evaluation, and dataset analysis.
| Argoverse2 | WOMD | nuScenes | UniTraj | ||
|---|---|---|---|---|---|
| Coordinate frame | Scene-centric | Scene-centric | Scene-centric | Agent-centric | |
| Time length | Past | 5 sec | 1 sec | 2 sec | [0 - 8] sec |
| Future | 6 sec | 8 sec | 6 sec | [1 - 8] sec | |
| Agent features | Annotations | velocity, heading | velocity, heading | velocity, heading | velocity, heading |
| Other info | — | bounding box size | — | acceleration | |
| Coordinates | 2D | 3D | 2D | 2D | |
| Map features | Range | 200m | 200m | 500m | [0 - 500] m |
| Resolution | 0.2m2m | 0.5m | 1m | [0.2 - 2] m | |
| Coordinates | 2D | 3D | 2D | 2D |
3.1 Unified data
Two types of discrepancies are found across trajectory forecasting datasets: data formats and data features. The former amounts to differences in the way data is structured and organized, while the latter stems from differences in the characteristics of the data itself, such as spatio-temporal resolution, range, and agent and map annotation taxonomy. In this section, we present solutions to tackle both types of discrepancies.
3.1.1 Unified data format:
To address the issue of different data formats used in trajectory prediction datasets, such as TFRecord in WOMD [14] and Apache Parquet in Argoverse 2 [50], we utilize ScenarioNet [28]. ScenarioNet was initially designed for traffic scenario simulation and modeling, but we repurposed it for the vehicle trajectory prediction task. It provides a unified scenario description format containing HD maps and detailed object annotations, which simplifies the process of decoding the dataset with different formats. ScenarioNet currently supports converting WOMD, nuScenes, and nuPlan, and we extend its support to Argoverse 2 for our research. This reduces the need for multiple versions of preprocessing code to extract information from raw datasets and create batched data for the training of prediction models.
3.1.2 Unified data features:
Despite the data being converted into a unified format, significant discrepancies persist across the datasets, affecting model performance.
For example, the scenarios are seconds long in Argoverse 2, while they are seconds in WOMD; or the precision of map annotations are meters in nuScenes while they are meters in WOMD.
Therefore, we aim to harmonize these discrepancies and minimize their impact on the model’s performance.
Table 1 summarizes the discrepancies and the unified features.
Our data processing approach involves specific harmonizations, including the following:
-
•
Coordinate Frame. Recent trajectory prediction models predominantly utilize vectorized, agent-centric data as input [46, 17, 35, 47, 58]. Our data processing pipeline is designed to transform scene-level raw data into this format. It processes traffic scenarios, which consist of multiple trajectories, and selects trajectories designated as training samples within the datasets. The pipeline then converts the entire scenario into the coordinate frames of these selected agents, and normalizes the input accordingly.
-
•
Time Length. The trajectories in different datasets are with the same frequency of Hz but with a duration ranging from 8 to 20 seconds. To standardize this aspect, we truncate all trajectories to a uniform length of 8 seconds. Within this duration, UniTraj provides the option to flexibly determine a unified length of past and future trajectories for all datasets.
-
•
Agent Features. Among the datasets, WOMD provides the most detailed agent information, including 3D coordinates, velocity, heading, and bounding box size, whereas nuScenes lacks certain data, like bounding box size. We standardize inputs across datasets by using 2D coordinates, velocity, and heading. Our data processing also introduces supplementary features, such as one-hot encoding of agent type and time steps of trajectories, and acceleration. These elements are combined to create a rich, unified input for the model.
-
•
Map Features. Datasets differ in HD map resolution. We normalize this by using linear interpolation to standardize the distance between consecutive points to 0.5 meters, with an option for further downsampling to adjust map resolution. Additionally, we enrich the data with each lane point’s direction and one-hot encode lane types. Our experiments utilize semantic map classes such as center lanes, road lines, crosswalks, speed bumps, and stop signs.
Our framework allows for customization of specific features through predefined parameters for focused single-dataset research, while still providing a standardized data format across all datasets. The data processing module supports various parameters, such as the length of historical and future trajectories, number of points per lane, map resolution, types of surrounding agents and lines, and masked attributes. Thanks to its modular structure, our data processing pipeline enables easy integration of new processing methodologies and models. The framework is equipped with multi-processing and caching mechanisms for efficient processing. Our framework currently includes four large-scale, real-world datasets with over 1337 hours of driving data from 15 cities.
3.2 Unified models
Trajectory prediction models are often implemented in different pipelines, making direct comparisons challenging and fairness hard to ensure. We integrate three recent trajectory prediction models within the UniTraj framework. These models were chosen based on their state-of-the-art results on various benchmarks, indicating the research value of their designs. We include:
-
•
AutoBot [17] is a recent transformer-based model with competitive results on multiple existing datasets. It is based on equivariant feature learning to learn the joint distribution of trajectories with multi-head attention blocks.
-
•
MTR [46] ranked first on the WOMD Challenge in 2022. It operates by integrating global intention priors with local movement refinement. It uses a limited number of adaptable motion query pairs, allowing precise trajectory prediction and improvement for different motion types.
-
•
Wayformer [35] is a transformer-based model, featuring a multi-axis encoder. It employs latent queries that facilitate the combination of multi-dimensional inputs. We re-implement the model, as the original code has not been released.
The models’ capacities cover a large range (M parameters for AutoBot, M for MTR, and M for Wayformer), enabling research on model size and scaling.
Integrating new models:
The flexibility of UniTraj’s data processing pipeline greatly simplifies the integration of new models.
Furthermore, we provide a standardized output format, enabling seamless use of UniTraj’s evaluation and logging tools.
3.3 Unified evaluation
In trajectory prediction, various metrics have been proposed to evaluate the models, yet there is no consensus about them. As a result, each dataset provides a different set of evaluation metrics, making it challenging to compare performances across datasets. For example, WOMD employs mean average precision (mAP) metric [14] while Argoverse 2 uses brier minimum Final Displacement Error (brier-minFDE) [50]. Our framework provides a unified set of metrics to allow comprehensive and consistent evaluation across different datasets. To this end, we employ two sets of metrics: general and fine-grained evaluation metrics.
3.3.1 General evaluations:
The most common metrics in the literature are the ones that provide an overall score based on accuracy measures by comparing the output with the ground truth in different aspects.
We include the following three general metrics in the framework:
1) Minimum Average / Final Displacement Error (minADE/minFDE): It represents the minimum average/final displacement error between the predictions and the ground truth. The minimum is computed over the modes of the output.
2) Miss Rate (MR):
It is defined as the ratio of the samples with minFDE exceeding meters, and is useful where up to meters deviation is acceptable.
3) Brier Minimum Final Displacement Error (brier-minFDE): While the previous metrics focus on covering the ground truth, they do not account for the probability assigned to each predicted trajectory. The brier-minFDE metric addresses this by adding a penalty term, , to the minFDE where corresponds to the probability of the trajectory that best matches the ground truth.
Fine-grained evaluations:
We also provide two fine-grained evaluations.
(1) Trajectory types.
Datasets usually exhibit a significant prevalence of ‘straight’ trajectories, resulting in heavily imbalanced datasets. Besides, we argue that rare trajectory types can sometimes be the more safety-critical ones.
Therefore, it is critical to specifically access prediction performances on rare situations and trajectory types.
To address this, the UniTraj framework enables the stratification of evaluation metrics based on trajectory types. In practice, we adopt the trajectory taxonomy defined in the WOMD challenge [14], to categorize trajectories into the following groups: ‘stationary’, ‘straight’, ‘straight left’, ‘straight right’, ‘left-turn’, ‘right-turn’, ‘left u-turn’, ‘right u-turn’.
While the use of this taxonomy provides valuable insights, its scope has limitations as it does not account for variations in motion dynamics.
For instance, it does not differentiate between straight accelerating and decelerating trajectories, both of which are categorized as ‘straight’.
Consequently, we additionally use the notion of ‘Kalman difficulty’ introduced below.
(2) Kalman difficulty. Some situations are more challenging to forecast than others, typically when the future is not a simple extrapolation of the past and when contextual factors play a significant role. The context encloses various elements such as map data, social interactions, or input signals coming from perception. Moreover, previous works [33, 4, 48] observe that these complex scenarios, while critical, are much less frequent than scenarios that are easier to forecast. To specifically evaluate the performance over critical cases, and reduce evaluation noise coming from the large number of simple scenarios, the authors in [33] propose to filter them as the ones with a high mismatch between their ground truth and predictions from a Kalman filter [23]. We follow this idea as it offers a simple method to evaluate how challenging a situation is. Accordingly, UniTraj stratifies evaluation metrics based on Kalman difficulty that we define as the FDE between the ground-truth trajectory and the prediction of a linear Kalman filter.
4 Experiments
The UniTraj framework opens up new opportunities for research and experimentation. This section presents experiments highlighting these opportunities, focusing on cross-domain (i.e., cross-dataset and cross-city) generalization (RQ1) in Section 4.1, and data scaling impact (RQ2) for trajectory prediction models in Section 4.2. We provide fine-grained dataset analyses and discussions in Section 4.3. Additional experiments in the appendix, such as continual learning and synthetic-to-real transfer, further demonstrate the framework’s research utility.
Experimental settings: We replicate the model configurations and hyper-parameters from their original implementations. Throughout the experiments, we have limited the training and validation samples to vehicle trajectories. The map range extends to a m radius with a spatial resolution of m. The temporal parameters are set to seconds of historical trajectories and second future trajectories. For our multi-dataset training experiments, we utilize WOMD [14], Argoverse 2 [50], and nuScenes [7] datasets. Since the nuPlan [8] dataset is oriented towards planning tasks and lacks an official training/validation set for prediction tasks, we exclusively use it for the cross-city generalization studies due to its large number of samples for different cities. We only report the results with the brier-minFDE metric and leave other metrics for the appendix.
4.1 Generalization evaluation
Generalization to new domains is a crucial challenge for data-driven models, necessitating diverse data for comprehensive evaluation. The UniTraj framework enables the exploration of model generalization across various datasets and cities.
4.1.1 Cross-dataset evaluation:
To assess the generalization capabilities of models, we train models on each individual dataset and evaluate their performance on all other available datasets. The findings are presented in Table 2. Analyzing the data in different columns of the table, the first observation is that all models’ performances decline significantly when models are tested on other datasets. This is a consistent trend across all of the three model architectures, and all of the considered datasets. For instance, the second column under MTR reports the performance evaluated on the validation set of Argoverse 2. It indicates that MTR achieves its peak performance when it is trained on the training set of Argoverse 2 itself, while models trained on nuScenes and WOMD exhibit significantly lower performances.
With a more detailed investigation, we can also compare the generalization capabilities of different datasets. For instance, considering the same column, the model trained on WOMD outperforms the one trained on nuScenes when evaluated on the Argoverse2 dataset. By making similar comparisons across other columns, we establish a generalization order: models trained on WOMD data exhibit the highest generalization ability, followed by those trained on Argoverse2, and then nuScenes. This order remains consistent across all models. The superior generalization of models trained on WOMD can be attributed to both the larger number of data samples and the greater variety present in the WOMD dataset. We provide a more detailed explanation in Section 4.3, where we discuss the specific characteristics of each dataset and their influence on model performance and generalization.
| MTR [46] | Wayformer * [35] | AutoBot [17] | ||||||||
| Evaluation | ||||||||||
| Training | #trajs | nuScenes | Argoverse 2 | WOMD | nuScenes | Argoverse 2 | WOMD | nuScenes | Argoverse 2 | WOMD |
| nuScenes | 32k | 3.06 | 4.67 | 7.53 | 3.85 | 4.93 | 7.74 | 3.36 | 4.48 | 6.89 |
| Argoverse 2 | 180k | 3.89 | 2.31 | 4.84 | 5.21 | 2.85 | 5.43 | 4.35 | 2.51 | 4.43 |
| WOMD | 1800k | 3.28 | 3.84 | 2.37 | 3.75 | 3.64 | 2.64 | 3.73 | 3.23 | 2.47 |
| All | 2012k | 2.49 | 2.22 | 2.37 | 3.34 | 2.56 | 2.61 | 3.07 | 2.54 | 2.47 |
4.1.2 Cross-city evaluation:
Despite our care to standardize data formats and align features among datasets, certain fundamental discrepancies may persist caused by the data collection and annotation processes. For instance, annotation noises could still exist across datasets. To control for this potential residual discrepancy, we explore the generalization of AutoBot when the city is changed inside a single dataset. Similar to the previous experiment, we train AutoBot on each city and evaluate it on the rest of cities. We employed nuPlan [8] data for this experiment due to the large number of samples existing in diverse cities and selected K samples from each city. The results are shown in Table 3. It shows that the performance of AutoBot drops once evaluated on other cities. For instance, the first row shows that the model trained on Pittsburgh has the best performance on Pittsburgh (brier-minFDE ) and worse performances on Boston () and Singapore (). This indicates a clear generalization gap between cities, emphasizing the discrepancies between different environments. Moreover, it can also be observed that the model trained on Singapore performs the worst on average.
Takeaways: The findings in this section reveal that state-of-the-art models trained on recent large-scale datasets struggle to generalize to new domains. As a concrete recommendation, it highlights the importance of geographical diversity in the data collection process for both training and evaluation.
| Evaluation | ||||
|---|---|---|---|---|
| Training | Pittsburgh | Boston | Singapore | Average |
| Pittsburgh | 2.4 | 2.7 | 3.5 | 2.8 |
| Boston | 4.1 | 2.2 | 3.4 | 3.2 |
| Singapore | 4.9 | 3.5 | 2.1 | 3.5 |
4.2 Scaling data to 2M trajectories.
The unified data available in UniTraj forms the largest public data one can use to train a trajectory prediction model. In this section, we explore if we can improve the models’ performance by simply scaling the size of the training dataset. Therefore, we combine all the existing real datasets in UniTraj into a single large training set on which we train the considered models. The results of this experiment are presented at the bottom of Table 2 (row ‘All’), demonstrating improvements over the model trained solely on a single dataset. While the improvements are not identical for different datasets, they are particularly significant in the case of the nuScenes dataset, making the MTR model trained on combined data rank st in the nuScenes leaderboard (shown in Section 4.2). For instance, training the MTR model on "All" datasets enables it to outperform the model trained on nuScenes and Argoverse2 by a large margin. Moreover, while the performance on WOMD has not been improved, the resulting model performs much better than the model trained on WOMD on other datasets. These improvements are attributed to the relatively larger size and diversity of the combined dataset compared to each individual one. We elaborate on this more in Section 4.3.
The table also shows that certain models benefit more from larger data sizes compared to others. Specifically, when looking at the performance on Argoverse 2 and nuScenes datasets, which benefit from the increased dataset size, models like MTR and Wayformer show more significant improvements than AutoBot. This difference in performance enhancement is attributed to the models’ capacity. For instance, MTR has M parameters, providing it with a higher capacity to learn from larger datasets, whereas AutoBot, with only million parameters, may not be as able to utilize the additional data.
In order to illustrate the impact of data size on the performance of a trajectory predcition model, we gradually increase the number of training samples from % to % of the combined dataset. We then report the AutoBot model’s performance using the average brier-minFDE metric among all three datasets. Section 4.2 shows the curve revealing a consistent reduction in the prediction error once the dataset size increases. This highlights the substantial benefits of larger datasets on the model’s performance and offers prospects for improved performances with larger data sizes.
Takeaways: The experimental results underscore the potential and need for larger, more diverse datasets in the trajectory prediction field. Such datasets will also push the boundaries of the current performances of the models.
![[Uncaptioned image]](x2.png)
4.3 Analyzing the results
In this section, we aim to explain the findings related to generalization gaps and the data scaling impact observed in Sections 4.1.1 and 4.2. To do so, we first delve into a comparative analysis of datasets integrated within the UniTraj framework with our fine-grained evaluations. We then employ these insights to understand the findings.
4.3.1 Dataset analysis.
We provide an in-depth comparison between datasets to help the understanding of the results presented in previous subsections. Moreover, the insights aid in making informed decisions about selecting the most appropriate datasets and settings for specific research or application needs.
Trajectory type based comparison: The analysis of trajectory types in the WOMD, Argoverse 2, and nuScenes datasets in Figure 2(a) reveals trajectory type imbalances, primarily featuring a prevalence of straight trajectories, constituting 54% to 68% of all trajectories, with minimal instances of u-turns. WOMD exhibits a notably diverse trajectory mix, with a significant number of left and right turn trajectories, approximately two times more than what is observed in Argoverse 2 and nuScenes. This stands in contrast to Argoverse 2 and nuScenes, which primarily contain straight trajectories over varied turning maneuvers.
Kalman difficulty based comparison: The distribution of sample difficulties within the WOMD, Argoverse 2, and nuScenes datasets, shown in Figure 2(b), exhibits a consistent trend where easier scenarios significantly outnumber more challenging ones. WOMD demonstrates a relatively balanced distribution across lower to moderate difficulty levels, with around 24% of trajectories falling within the easiest category (Kalman difficulties up to 10), with a consistent presence observed up to a Kalman difficulty of 50.0. In contrast, both nuScenes and Argoverse 2 exhibit a substantial bias towards easier difficulties, comprising approximately 42% and 46% of samples, respectively, in the lowest difficulty range (Kalman difficulties lower than 10), and show a sharp decrease in proportion with increasing difficulty levels, indicating datasets primarily composed of simpler scenarios which may potentially limit their efficacy in training models for more complex situations.
| Traj. Type | Stationary | Straight | Straight right | Straight left | Right u-turn | Right-turn | Left u-turn | Left-turn | All |
|---|---|---|---|---|---|---|---|---|---|
| MTR (nuScenes) | 2.15 | 2.58 | 4.85 | 4.26 | 8.13 | 4.82 | 5.17 | 4.85 | 3.06 |
| MTR (All) | 2.23 | 2.31 | 3.13 | 3.06 | 2.98 | 3.53 | 2.10 | 2.82 | 2.49 |
| Evaluation | ||||
|---|---|---|---|---|
| Training | Argoverse 2 | WOMD | nuScenes | Average |
| Argoverse 2 | 2.90 | 5.07 | 4.67 | 4.21 |
| WOMD | 4.04 | 3.22 | 4.42 | 3.89 |
| nuScenes | 4.48 | 6.88 | 3.38 | 4.91 |
| All | 2.80 | 3.13 | 3.25 | 3.06 |
| Kalman | Easy | Medium | Hard |
|---|---|---|---|
| difficulty | |||
| MTR (nuScenes) | 2.93 | 4.72 | 5.01 |
| MTR (All) | 2.43 | 3.17 | 7.86 |
Explaining the findings in cross-dataset generalization and multi-dataset training experiments: Our cross-dataset generalization experiment in Section 4.1.1 shows that models do not generalize equally across different datasets. Notably, models trained on WOMD generalize better to other datasets. Furthermore, models trained on combined datasets exhibit considerable improvements. To understand these phenomena, it’s important to delve into the differences between datasets, focusing on two main aspects: size and diversity.
To investigate the impact of dataset size, we replicate the cross-dataset generalization experiments (Table 2), but with control on the dataset size, as we select k random samples for each dataset’s training set. Table 7 shows the results. The last column shows the generalization hierarchy where again the WOMD generalizes best, followed by Argoverse 2 and then nuScenes. This shows that better cross-dataset generalization is not solely attributed to the size of the datasets. The last row illustrates that for multi-dataset training, there is a considerable improvement for all the datasets, highlighting the pronounced benefit of adding more data in small-scale dataset scenarios.
Section 4.3.1 reveals that the datasets are dissimilar in terms of diversity. Notably, WOMD encompasses the most diverse range of scenarios in comparison to other datasets. This explains the superior generalization of WOMD to other datasets, as the diversity enables models to learn the full spectrum of data distributions more comprehensively. Similarly, the combined dataset provides a more diverse collection of trajectories, leading to enhanced performance for the models. To demonstrate this, we compare the fine-grained evaluations of MTR model trained on nuScenes and the combined dataset. Table 5 shows the per trajectory type performance of the two models where the model trained on full data outperforms in every trajectory type since the full data includes significantly more samples from each trajectory type. We also compare the performances using the Kalman difficulty measure in Table 7. The combined data has considerably more medium-difficulty samples (shown in Figure 2(b)) leading to significant performance improvements in the medium-range samples. We also note a performance drop in hard examples due to the insufficient challenging scenarios in the datasets. These results highlight the importance of diversity in the data.
5 Conclusions
In conclusion, our study examines two critical research questions essential for advancing the field of vehicle trajectory prediction. We’ve uncovered that models face significant challenges in generalizing across different domains (RQ1), exhibiting considerable performance drops when encountering new datasets or cities. Additionally, our findings affirm that larger, more diverse datasets significantly boost model performance and generalization capabilities (RQ2), underscoring the importance of data richness. Besides, we release the UniTraj framework as a versatile tool that opens up new opportunities for exploration in trajectory predictions. We believe that this framework will help significantly in advancing data-centric research in the field of trajectory prediction.
Limitations: Our framework currently supports only vectorized inputs, limiting its use in visual-based methods. It primarily focuses on vehicle trajectories, omitting pedestrian dynamics. Future work will extend its capabilities to include raw perception data and pedestrian trajectories.
Acknowledgments: Authors would like to thank Mickaël Chen, Quanyi Li, Ahmad Rahimi, Yihong Xu, Olaf Dunkel and Ahmad Salimi for their helpful discussions and helps on preliminary versions of this work. The project was partially funded by Honda R&D Co., Ltd, Valeo Paris, and ANR grant MultiTrans (ANR-21-CE23-0032).
References
- [1] Javad Amirian, Bingqing Zhang, Francisco Valente Castro, Juan Jose Baldelomar, Jean-Bernard Hayet, and Julien Pettré. Opentraj: Assessing prediction complexity in human trajectories datasets. In Proceedings of the asian conference on computer vision, 2020.
- [2] Mohammadhossein Bahari, Ismail Nejjar, and Alexandre Alahi. Injecting knowledge in data-driven vehicle trajectory predictors. Transportation research part C: emerging technologies, 128:103010, 2021.
- [3] Mohammadhossein Bahari, Saeed Saadatnejad, Ahmad Rahimi, Mohammad Shaverdikondori, Amir Hossein Shahidzadeh, Seyed-Mohsen Moosavi-Dezfooli, and Alexandre Alahi. Vehicle trajectory prediction works, but not everywhere. In Proceedings of the IEEE/CVF Conference on Computer Vision and Pattern Recognition, pages 17123–17133, 2022.
- [4] Hedi Ben-Younes, Éloi Zablocki, Mickaël Chen, Patrick Pérez, and Matthieu Cord. Raising context awareness in motion forecasting. In CVPRW, pages 4408–4417. IEEE, 2022.
- [5] Prarthana Bhattacharyya, Chengjie Huang, and Krzysztof Czarnecki. Ssl-lanes: Self-supervised learning for motion forecasting in autonomous driving. In Conference on Robot Learning, pages 1793–1805. PMLR, 2023.
- [6] Julian Bock, Robert Krajewski, Tobias Moers, Steffen Runde, Lennart Vater, and Lutz Eckstein. The ind dataset: A drone dataset of naturalistic road user trajectories at german intersections. In 2020 IEEE Intelligent Vehicles Symposium (IV), pages 1929–1934. IEEE, 2020.
- [7] Holger Caesar, Varun Bankiti, Alex H Lang, Sourabh Vora, Venice Erin Liong, Qiang Xu, Anush Krishnan, Yu Pan, Giancarlo Baldan, and Oscar Beijbom. nuscenes: A multimodal dataset for autonomous driving. In Proceedings of the IEEE/CVF conference on computer vision and pattern recognition, pages 11621–11631, 2020.
- [8] Holger Caesar, Juraj Kabzan, Kok Seang Tan, Whye Kit Fong, Eric Wolff, Alex Lang, Luke Fletcher, Oscar Beijbom, and Sammy Omari. nuplan: A closed-loop ml-based planning benchmark for autonomous vehicles. arXiv preprint arXiv:2106.11810, 2021.
- [9] Yulong Cao, Chaowei Xiao, Anima Anandkumar, Danfei Xu, and Marco Pavone. Advdo: Realistic adversarial attacks for trajectory prediction. In European Conference on Computer Vision, pages 36–52. Springer, 2022.
- [10] Ming-Fang Chang, John Lambert, Patsorn Sangkloy, Jagjeet Singh, Slawomir Bak, Andrew Hartnett, De Wang, Peter Carr, Simon Lucey, Deva Ramanan, et al. Argoverse: 3d tracking and forecasting with rich maps. In Proceedings of the IEEE/CVF Conference on Computer Vision and Pattern Recognition (CVPR), 2019.
- [11] Guangyi Chen, Junlong Li, Jiwen Lu, and Jie Zhou. Human trajectory prediction via counterfactual analysis. In ICCV, pages 9804–9813. IEEE, 2021.
- [12] Jiuyu Chen, Zhongli Wang, Jian Wang, and Baigen Cai. Q-eanet: Implicit social modeling for trajectory prediction via experience-anchored queries. IET Intelligent Transport Systems, 2023.
- [13] Pasquale Coscia, Francesco Castaldo, Francesco AN Palmieri, Alexandre Alahi, Silvio Savarese, and Lamberto Ballan. Long-term path prediction in urban scenarios using circular distributions. Journal on Image and Vision Computing, 69:81–91, 2018.
- [14] Scott Ettinger, Shuyang Cheng, Benjamin Caine, Chenxi Liu, Hang Zhao, Sabeek Pradhan, Yuning Chai, Ben Sapp, Charles R Qi, Yin Zhou, et al. Large scale interactive motion forecasting for autonomous driving: The waymo open motion dataset. In Proceedings of the IEEE/CVF International Conference on Computer Vision, pages 9710–9719, 2021.
- [15] William Falcon and The PyTorch Lightning team. PyTorch Lightning, Mar. 2019.
- [16] Thomas Gilles, Stefano Sabatini, Dzmitry Tsishkou, Bogdan Stanciulescu, and Fabien Moutarde. Uncertainty estimation for cross-dataset performance in trajectory prediction. IEEE Int. Conf. on Robotics and Automation Workshop on Fresh Perspectives on the Future of Autonomous Driving, 2022.
- [17] Roger Girgis, Florian Golemo, Felipe Codevilla, Martin Weiss, Jim Aldon D’Souza, Samira Ebrahimi Kahou, Felix Heide, and Christopher Pal. Latent variable sequential set transformers for joint multi-agent motion prediction. In International Conference on Learning Representations, 2022.
- [18] Chengcheng Guo, Bo Zhao, and Yanbing Bai. Deepcore: A comprehensive library for coreset selection in deep learning. In International Conference on Database and Expert Systems Applications, pages 181–195. Springer, 2022.
- [19] John Houston, Guido Zuidhof, Luca Bergamini, Yawei Ye, Long Chen, Ashesh Jain, Sammy Omari, Vladimir Iglovikov, and Peter Ondruska. One thousand and one hours: Self-driving motion prediction dataset. In Conference on Robot Learning, pages 409–418. PMLR, 2021.
- [20] Kai-Chieh Hsu, Karen Leung, Yuxiao Chen, Jaime Fernàndez Fisac, and Marco Pavone. Interpretable trajectory prediction for autonomous vehicles viacounterfactual responsibility. In IEEE/RSJ Int. Conf. on Intelligent Robots & Systems, 2023.
- [21] Boris Ivanovic, Guanyu Song, Igor Gilitschenski, and Marco Pavone. trajdata: A unified interface to multiple human trajectory datasets. In Proceedings of the Neural Information Processing Systems (NeurIPS) Track on Datasets and Benchmarks, New Orleans, USA, Dec. 2023.
- [22] Chiyu Jiang, Andre Cornman, Cheolho Park, Benjamin Sapp, Yin Zhou, Dragomir Anguelov, et al. Motiondiffuser: Controllable multi-agent motion prediction using diffusion. In Proceedings of the IEEE/CVF Conference on Computer Vision and Pattern Recognition, pages 9644–9653, 2023.
- [23] Rudolph Emil Kalman. A new approach to linear filtering and prediction problems. 1960.
- [24] Dongwan Kim, Yi-Hsuan Tsai, Yumin Suh, Masoud Faraki, Sparsh Garg, Manmohan Chandraker, and Bohyung Han. Learning semantic segmentation from multiple datasets with label shifts. In European Conference on Computer Vision, pages 20–36. Springer, 2022.
- [25] James Kirkpatrick, Razvan Pascanu, Neil Rabinowitz, Joel Veness, Guillaume Desjardins, Andrei A Rusu, Kieran Milan, John Quan, Tiago Ramalho, Agnieszka Grabska-Barwinska, et al. Overcoming catastrophic forgetting in neural networks. Proceedings of the national academy of sciences, 114(13):3521–3526, 2017.
- [26] Parth Kothari, Sven Kreiss, and Alexandre Alahi. Human trajectory forecasting in crowds: A deep learning perspective. IEEE Transactions on Intelligent Transportation Systems, 2021.
- [27] Parth Kothari, Danya Li, Yuejiang Liu, and Alexandre Alahi. Motion style transfer: Modular low-rank adaptation for deep motion forecasting. In CoRL, volume 205 of Proceedings of Machine Learning Research, pages 774–784. PMLR, 2022.
- [28] Quanyi Li, Zhenghao Peng, Lan Feng, Zhizheng Liu, Chenda Duan, Wenjie Mo, and Bolei Zhou. Scenarionet: Open-source platform for large-scale traffic scenario simulation and modeling. Advances in Neural Information Processing Systems, 2023.
- [29] Quanyi Li, Zhenghao Peng, Lan Feng, Qihang Zhang, Zhenghai Xue, and Bolei Zhou. Metadrive: Composing diverse driving scenarios for generalizable reinforcement learning. IEEE transactions on pattern analysis and machine intelligence, 45(3):3461–3475, 2022.
- [30] Junwei Liang, Enwei Zhang, Jun Zhang, and Chunhua Shen. Multi-dataset training of transformers for robust action recognition. Advances in Neural Information Processing Systems, 35:14475–14488, 2022.
- [31] Ming Liang, Bin Yang, Rui Hu, Yun Chen, Renjie Liao, Song Feng, and Raquel Urtasun. Learning lane graph representations for motion forecasting. In Computer Vision–ECCV 2020: 16th European Conference, Glasgow, UK, August 23–28, 2020, Proceedings, Part II 16, pages 541–556. Springer, 2020.
- [32] Yuejiang Liu, Riccardo Cadei, Jonas Schweizer, Sherwin Bahmani, and Alexandre Alahi. Towards robust and adaptive motion forecasting: A causal representation perspective. In CVPR, pages 17060–17071. IEEE, 2022.
- [33] Osama Makansi, Özgün Çiçek, Yassine Marrakchi, and Thomas Brox. On exposing the challenging long tail in future prediction of traffic actors. In ICCV, pages 13127–13137. IEEE, 2021.
- [34] Andrey Malinin, Neil Band, German Chesnokov, Yarin Gal, Mark JF Gales, Alexey Noskov, Andrey Ploskonosov, Liudmila Prokhorenkova, Ivan Provilkov, Vatsal Raina, et al. Shifts: A dataset of real distributional shift across multiple large-scale tasks. arXiv preprint arXiv:2107.07455, 2021.
- [35] Nigamaa Nayakanti, Rami Al-Rfou, Aurick Zhou, Kratarth Goel, Khaled S Refaat, and Benjamin Sapp. Wayformer: Motion forecasting via simple & efficient attention networks. In IEEE International Conference on Robotics and Automation (ICRA), pages 2980–2987. IEEE, 2023.
- [36] Jonah Philion, Xue Bin Peng, and Sanja Fidler. Trajeglish: Learning the language of driving scenarios. arXiv preprint arXiv:2312.04535, 2023.
- [37] Mozhgan Pourkeshavarz, Changhe Chen, and Amir Rasouli. Learn tarot with mentor: A meta-learned self-supervised approach for trajectory prediction. In Proceedings of the IEEE/CVF International Conference on Computer Vision, pages 8384–8393, 2023.
- [38] Alexandre Robicquet, Amir Sadeghian, Alexandre Alahi, and Silvio Savarese. Learning social etiquette: Human trajectory prediction in crowded scenes. In European Conference on Computer Vision (ECCV), volume 2, page 5, 2016.
- [39] Andrey Rudenko, Luigi Palmieri, Wanting Huang, Achim J Lilienthal, and Kai O Arras. The atlas benchmark: an automated evaluation framework for human motion prediction. In 2022 31st IEEE International Conference on Robot and Human Interactive Communication (RO-MAN), pages 636–643. IEEE, 2022.
- [40] Amir Sadeghian, Vineet Kosaraju, Agrim Gupta, Silvio Savarese, and Alexandre Alahi. Trajnet: Towards a benchmark for human trajectory prediction. arXiv preprint, 2018.
- [41] Jay Sarva, Jingkang Wang, James Tu, Yuwen Xiong, Sivabalan Manivasagam, and Raquel Urtasun. Adv3d: Generating safety-critical 3d objects through closed-loop simulation. CoRR, abs/2311.01446, 2023.
- [42] Maximilian Schäfer, Kun Zhao, and Anton Kummert. Caspnet++: Joint multi-agent motion prediction, 2023.
- [43] Ari Seff, Brian Cera, Dian Chen, Mason Ng, Aurick Zhou, Nigamaa Nayakanti, Khaled S Refaat, Rami Al-Rfou, and Benjamin Sapp. Motionlm: Multi-agent motion forecasting as language modeling. In Proceedings of the IEEE/CVF International Conference on Computer Vision, pages 8579–8590, 2023.
- [44] Wenbo Shao, Yanchao Xu, Jun Li, Chen Lv, Weida Wang, and Hong Wang. How does traffic environment quantitatively affect the autonomous driving prediction? IEEE Transactions on Intelligent Transportation Systems, 2023.
- [45] Bowen Shi, Xiaopeng Zhang, Haohang Xu, Wenrui Dai, Junni Zou, Hongkai Xiong, and Qi Tian. Multi-dataset pretraining: A unified model for semantic segmentation. arXiv preprint arXiv:2106.04121, 2021.
- [46] Shaoshuai Shi, Li Jiang, Dengxin Dai, and Bernt Schiele. Motion transformer with global intention localization and local movement refinement. Advances in Neural Information Processing Systems, 35:6531–6543, 2022.
- [47] Balakrishnan Varadarajan, Ahmed Hefny, Avikalp Srivastava, Khaled S Refaat, Nigamaa Nayakanti, Andre Cornman, Kan Chen, Bertrand Douillard, Chi Pang Lam, Dragomir Anguelov, et al. Multipath++: Efficient information fusion and trajectory aggregation for behavior prediction. In 2022 International Conference on Robotics and Automation (ICRA), pages 7814–7821. IEEE, 2022.
- [48] Yuning Wang, Pu Zhang, Lei Bai, and Jianru Xue. FEND: A future enhanced distribution-aware contrastive learning framework for long-tail trajectory prediction. In CVPR, pages 1400–1409. IEEE, 2023.
- [49] Xinshuo Weng, Boris Ivanovic, Kris Kitani, and Marco Pavone. Whose track is it anyway? improving robustness to tracking errors with affinity-based trajectory prediction. In CVPR, pages 6563–6572. IEEE, 2022.
- [50] Benjamin Wilson, William Qi, Tanmay Agarwal, John Lambert, Jagjeet Singh, Siddhesh Khandelwal, Bowen Pan, Ratnesh Kumar, Andrew Hartnett, Jhony Kaesemodel Pontes, et al. Argoverse 2: Next generation datasets for self-driving perception and forecasting. arXiv preprint arXiv:2301.00493, 2023.
- [51] Yihong Xu, Loïck Chambon, Éloi Zablocki, Mickaël Chen, Alexandre Alahi, Matthieu Cord, and Patrick Pérez. Towards motion forecasting with real-world perception inputs: Are end-to-end approaches competitive? In ICRA, 2024.
- [52] Zhen Yao, Xin Li, Bo Lang, and Mooi Choo Chuah. Goal-lbp: Goal-based local behavior guided trajectory prediction for autonomous driving. IEEE Transactions on Intelligent Transportation Systems, pages 1–10, 2023.
- [53] Luyao Ye, Zikang Zhou, and Jianping Wang. Improving the generalizability of trajectory prediction models with frenet-based domain normalization. IEEE International Conference on Robotics and Automation (ICRA), 2023.
- [54] Ruonan Yu, Songhua Liu, and Xinchao Wang. Dataset distillation: A comprehensive review. IEEE Transactions on Pattern Analysis and Machine Intelligence, 2023.
- [55] Wei Zhan, Liting Sun, Di Wang, Haojie Shi, Aubrey Clausse, Maximilian Naumann, Julius Kummerle, Hendrik Konigshof, Christoph Stiller, Arnaud de La Fortelle, et al. Interaction dataset: An international, adversarial and cooperative motion dataset in interactive driving scenarios with semantic maps. arXiv preprint arXiv:1910.03088, 2019.
- [56] Pu Zhang, Lei Bai, Jianru Xue, Jianwu Fang, Nanning Zheng, and Wanli Ouyang. Trajectory forecasting from detection with uncertainty-aware motion encoding. CoRR, abs/2202.01478, 2022.
- [57] Xingyi Zhou, Vladlen Koltun, and Philipp Krähenbühl. Simple multi-dataset detection. In Proceedings of the IEEE/CVF Conference on Computer Vision and Pattern Recognition, pages 7571–7580, 2022.
- [58] Zikang Zhou, Jianping Wang, Yung-Hui Li, and Yu-Kai Huang. Query-centric trajectory prediction. In Proceedings of the IEEE/CVF Conference on Computer Vision and Pattern Recognition, pages 17863–17873, 2023.
6 Appendix
In this appendix, we provide additional content to complement our main paper. This includes a set of experiments that further illuminate the capabilities of the UniTraj framework for the research community (see Section 6.1), additional results including cross-checking the performance of models and reporting other metrics (see Section 6.2), and more details about UniTraj framework (see Section 6.3).
6.1 Further experimentation with UniTraj
UniTraj is a flexible and comprehensive tool that opens up various research opportunities. While we have shown some of these in the main paper, we demonstrate other opportunities and capabilities of the framework here.
6.1.1 Continual learning on multiple datasets
Adapting trajectory prediction models to new datasets without erasing prior knowledge, termed catastrophic forgetting [25], is crucial for autonomous driving models. Our results in Table 8 illustrate this challenge, where we train AutoBot on k samples of WOMD (resp. Argoverse 2) dataset followed by fine-tuning on Argoverse 2 (resp. WOMD). Fine-tuning a WOMD-trained model with Argoverse 2 data modestly improves performance in Argoverse 2 (improvement +0.92), but significantly hurts its WOMD performance (-0.52). Similarly, fine-tuning an Argoverse 2-trained model with WOMD data notably boosts WOMD performance (+2.06) but severely impacts Argoverse 2 performance (-0.98). This is attributed to the considerable domain gap between WOMD and Argoverse 2, as shown in our cross-dataset generalization experiment. This outcome exemplifies the issue of catastrophic forgetting, highlighting the challenge of balancing adaptation to new datasets without compromising performance on previously learned ones.
| Training | Finetuning | Improvement | Forgetting | |
|---|---|---|---|---|
| domain | domain | (finetun. dom.) | (train. dom.) | |
| WOMD | Argoverse 2 | + 0.92 | - 0.52 | |
| Argoverse 2 | WOMD | + 2.06 | - 0.98 |
| Training | minADE6 () | brier-minFDE () |
|---|---|---|
| PG | 8.36 | 14.35 |
| nuScenes | 1.28 | 3.55 |
| nuscenes and PG | 1.30 | 3.56 |
6.1.2 Synthetic data
Synthetic data serves as a cost-effective and versatile approach, particularly in autonomous driving, thanks to its ease of generation and capacity to simulate various, even rare, driving scenarios during training. In our approach, we leverage a large synthetic dataset created through Procedural Generation (PG) to pre-train our models. PG, a technique used in the MetaDrive simulator [29], facilitates the creation of varied traffic scenarios and maps based on predefined rules. In our experiment, we use the same setting of MetaDrive simulator; traffic density at 15 vehicles per 100 meters and incorporating 2 roadblocks in each scenario. This resulted in the creation of 30,000 unique scenarios.
We train AutoBot using the synthetic PG dataset and subsequently fine-tune it on the nuScenes dataset. The pre-training stage can be helpful for injecting basic behaviors in models, such as lane following and avoiding collisions. Table 9 shows the result of our experiment. The comparison between the first and second rows of the table reveals a notable domain gap between datasets. Specifically, the model trained on the PG dataset underperforms significantly on the nuScenes dataset. Moreover, the model does not show any substantial performance improvement after fine-tuning, compared to those that have not undergone pre-training. This outcome indicates that while synthetic data may potentially serve as a useful starting point for training and introducing models to a range of conditions, its effectiveness in improving real-world performance may be limited. This limitation is attributed to the domain gap between real and synthetic data, as well as the simplicity and limited diversity of the synthetic data. We believe that more realistic and diverse synthetic datasets might be helpful as a pre-training source.
| Traj. Type | Stationary | Straight | Straight right | Straight left | Right u-turn | Right-turn | Left u-turn | Left-turn | All |
|---|---|---|---|---|---|---|---|---|---|
| AutoBot | 1.50 | 2.21 | 2.77 | 2.69 | 8.06 | 2.99 | 4.32 | 2.69 | 2.47 |
| MTR | 1.09 | 2.13 | 2.86 | 2.90 | 5.96 | 2.83 | 4.58 | 2.64 | 2.37 |
6.1.3 Comparing different models’ performances using fine-grained evaluations:
We compare the performance of multiple trajectory prediction models in Table 2 of the main paper. The table provides a comparison between different models. Specifically, it shows performances of AutoBot and MTR on the WOMD dataset, where MTR achieves a lower error rate of , outperforming AutoBot’s . However, this is a course comparison without any details about the strengths and weaknesses of each model. Thanks to the fine-grained evaluation approach available in UniTraj, we provide a more detailed comparative analysis in Tables 10 and 11. The first table compares performances across different trajectory types. While MTR generally outperforms AutoBot, it falls behind in specific trajectories such as straight right, straight left, and left U-turns. The second table also reveals that AutoBot exceeds MTR in medium difficulty scenarios. These insights offer a more thorough comparison and help pinpoint specific areas of weakness in the models.
6.1.4 Other potential future directions
UniTraj framework paves the way toward building foundation models for trajectory forecasting. Foundation models are typically trained on vast datasets, which, as of now, are not readily available in the trajectory forecasting domain. An effective workaround is to utilize extensive synthetic data for initial model training, followed by fine-tuning on real-world datasets. UniTraj facilitates this approach by enabling the integration of various synthetic datasets alongside its collection of the largest real data currently available in this field. This direction of research is already gaining traction and some recent studies in trajectory forecasting have adopted the foundation model concept by tokenizing the action space and focusing on predicting the subsequent token [43, 36].
The framework also opens up opportunities for other research studies such as coreset selection and dataset distillation [18, 54]. This involves creating a compact subset of the trajectory data that encapsulates the majority of information from the combined dataset.
6.2 Complementary results
In this section, we present additional results that complement those featured in the main paper. We first provide performances of the prediction models integrated into the framework compared with their officially reported performance to verify our correct integration. Then, we report metrics beyond brie-minFDE for the results we presented in the paper.
6.2.1 Cross-checking the performance of baselines with original papers
For MTR, we report numbers on WOMD. We trained MTR on WOMD and in the same setting as the official setting, e.g., 1 second of past trajectories and 8 seconds of future trajectories. Then, we evaluate the model on the official WOMD validation set, using the official evaluation tool to report the numbers. The results in Table 12 show that the integrated MTR can achieve similar performance compared to the original implementation.
| mAP | minADE | minFDE | MissRate | |
|---|---|---|---|---|
| Vehicle | 0.44 | 0.78 | 1.55 | 0.16 |
| Pedestrian | 0.43 | 0.35 | 0.73 | 0.07 |
| Cyclist | 0.36 | 0.72 | 1.45 | 0.19 |
| Avg (ours) | 0.41 | 0.62 | 1.24 | 0.14 |
| Avg-original | 0.42 | 0.60 | 1.23 | 0.14 |
Similarly, for Wayformer, we report numbers on WOMD with the same data setting as the official setting. Since the original paper has not reported numbers on validation set, we compare our performance with MTR. The results in Table 13 show that our internal implementation of Wayformer outperforms MTR in terms of minADE and minFDE metrics. However, due to the absence of certain details from the Wayformer’s non-public implementation, there remains a discrepancy in mAP metric performance.
| mAP | minADE | minFDE | MissRate | |
|---|---|---|---|---|
| Vehicle | 0.28 | 0.67 | 1.39 | 0.14 |
| Pedestrian | 0.25 | 0.32 | 0.67 | 0.09 |
| Cyclist | 0.24 | 0.68 | 1.40 | 0.21 |
| Avg (ours) | 0.26 | 0.56 | 1.15 | 0.15 |
For Autobot, please refer to our results on the nuScenes leaderboard in Table 4 in the main paper.
6.2.2 Reporting other metrics
We extend our examination of model generalization capabilities, previously reported in the main paper using the brierFDE metric (Table 2), by presenting additional evaluation metrics: minFDE in Table 14, minADE in Table 15 and MR in Table 16. We report the metrics of the same experiments; training models on each dataset individually and evaluating their performance across all others.
Our expanded analysis confirms the observed trend of reduced model performance on unfamiliar datasets, a consistent result across the considered model architectures and datasets. It also reinforces the conclusions drawn in the main paper, illustrating the generalization hierarchy where WOMD-trained models outperform others, followed by Argoverse 2 and nuScenes.
We further confirm the benefit of training models on combined datasets, which aligns with the main paper’s insights, showing notable performance improvements, especially for nuScenes.
| MTR [46] | Wayformer * [35] | AutoBot [17] | ||||||||
| Evaluation | ||||||||||
| Training | #trajs | nuScenes | Argoverse 2 | WOMD | nuScenes | Argoverse 2 | WOMD | nuScenes | Argoverse 2 | WOMD |
| nuScenes | 32k | 2.33 | 3.89 | 6.72 | 2.83 | 3.87 | 6.75 | 2.62 | 3.70 | 5.85 |
| Argoverse 2 | 180k | 3.10 | 1.68 | 4.04 | 4.21 | 1.92 | 4.44 | 3.52 | 1.70 | 3.59 |
| WOMD | 1800k | 2.52 | 3.14 | 1.78 | 2.76 | 2.65 | 1.65 | 2.90 | 2.41 | 1.65 |
| All | 2012k | 1.81 | 1.61 | 1.78 | 2.35 | 1.57 | 1.62 | 2.24 | 1.73 | 1.66 |
| MTR [46] | Wayformer * [35] | AutoBot [17] | ||||||||
| Evaluation | ||||||||||
| Training | #trajs | nuScenes | Argoverse 2 | WOMD | nuScenes | Argoverse 2 | WOMD | nuScenes | Argoverse 2 | WOMD |
| nuScenes | 32k | 1.06 | 1.85 | 2.85 | 1.33 | 1.70 | 2.62 | 1.21 | 1.62 | 2.35 |
| Argoverse 2 | 180k | 1.42 | 0.85 | 1.73 | 1.70 | 0.95 | 1.83 | 1.59 | 0.85 | 1.43 |
| WOMD | 1800k | 1.17 | 1.50 | 0.78 | 1.33 | 1.25 | 0.73 | 1.42 | 1.15 | 0.73 |
| All | 2012k | 0.85 | 0.82 | 0.78 | 1.13 | 0.80 | 0.72 | 1.12 | 0.86 | 0.74 |
| MTR [46] | Wayformer * [35] | AutoBot [17] | ||||||||
| Evaluation | ||||||||||
| Training | #trajs | nuScenes | Argoverse 2 | WOMD | nuScenes | Argoverse 2 | WOMD | nuScenes | Argoverse 2 | WOMD |
| nuScenes | 32k | 0.41 | 0.58 | 0.71 | 0.48 | 0.61 | 0.74 | 0.40 | 0.52 | 0.65 |
| Argoverse 2 | 180k | 0.47 | 0.30 | 0.59 | 0.53 | 0.32 | 0.63 | 0.49 | 0.27 | 0.55 |
| WOMD | 1800k | 0.44 | 0.49 | 0.33 | 0.44 | 0.45 | 0.25 | 0.42 | 0.40 | 0.25 |
| All | 2012k | 0.32 | 0.28 | 0.33 | 0.33 | 0.23 | 0.24 | 0.36 | 0.27 | 0.25 |
6.3 More details about UniTraj framework
6.3.1 Training pipeline
The training pipeline within UniTraj is underpinned by PyTorch Lightning [15]. PyTorch Lightning is a sophisticated deep-learning framework that caters to the needs of AI researchers and machine-learning practitioners. In our implementation, we utilize PyTorch Lightning’s training module in Distributed Data-Parallel (DDP) mode, enabling efficient multi-GPU acceleration for enhanced training speed and effectiveness.
6.3.2 Training settings
In our experiments, we use 8 A100 GPUs to train all the models. The batch sizes for MTR, Wayformer, and Autobot are 256, 256 and 128 respectively. The training takes approximately 1 hour, 15 minutes and 5 minutes per epoch for MTR, Wayformer, and Autobot, respectively. We pick the checkpoint based on the best min-brierFDE on the validation set.