Uncertainty estimation for Cross-dataset performance in Trajectory prediction
Abstract
While a lot of work has been carried on developing trajectory prediction methods, and various datasets have been proposed for benchmarking this task, little study has been done so far on the generalizability and the transferability of these methods across dataset. In this paper, we observe the performance of two of the latest state-of-the-art trajectory prediction methods across four different datasets (Argoverse, NuScenes, Interaction, Shifts). This analysis allows to gain some insights on the generalizability proprieties of most recent trajectory prediction models and to analyze which dataset is more representative of real driving scenes and therefore enables better transferability. Furthermore we present a novel method to estimate prediction uncertainty and show how it could be used to achieve better performance across datasets.
Keywords: Trajectory Prediction, Autonomous Driving, Motion Forecasting
1 Introduction
Trajectory prediction is an essential step of the autonomous driving pipeline, and needs to be robust to any situation the self-driving vehicle may encounter. A failure to correctly predict the future of a neighboring car may lead to dangerous situations and even collisions. However, as learned methods grow in performance and popularity [1, 2, 3] by either extending existing traditional methods [4] or replacing them completely [5], so does the dependency to the data coverage these models are trained on. Such methods may encounter distributional shift due to changing geographical or weather conditions [6]. It becomes therefore crucial to study the adaptability and performance of these methods across varying distributions.
Multiple trajectory prediction datasets [7, 8, 9, 6] have been used separately to train and evaluate motion estimation models, but few works actually study the performance of their models on more than one of these datasets at a time, and even more importantly, no study has yet been done to evaluate the representative coverage and generalization potential of the datasets across each other.
One recurring proposal to help with distributional shift is the use of uncertainty estimation. However, while this uncertainty is presented as a shift detector [6, 10, 11], no practical use of this value has been proposed yet to actually diminish the impact of distributional shift.
This work present two main contributions:
-
•
We realize the first cross-dataset study in vehicle trajectory prediction and assess which datasets transfer best to others.
-
•
We introduce a new way of estimating the model uncertainty by training the prediction model to output an heatmap. The model uncertainty is measured evaluating the spread of the predicted heatmap. We demonstrate that using this uncertainty to control the diversity of the predicted future trajectories leads to better performance on both single and cross-dataset evaluation.
2 Related work
In order to be exhaustive, a trajectory prediction model needs to be multimodal so it can represents all possible futures. The common approach is to have the model predict possible trajectories and only train the one closest to ground truth [12, 13, 14], or to use a mixture of Gaussians trained with their likelihood [15, 16]. Variational methods can also be applied [17, 18, 19, 20, 21, 22, 23, 24] to sample multiple outcomes. A more explicit approach is to leverage explicit existing modalities such as clusters [25, 26] or map elements [27, 28, 29, 30] to build possible trajectories upon. Transformer architectures also suit notably well to decode multiple modalities from separate learned embeddings [31, 32, 33, 10, 11]. Another way to obtain an exhaustive outcome is to use a heatmap as the output of the model. This heatmap can either represent a single agent future distribution [34, 35, 36, 37, 38] or the occupancy of all present vehicles [39, 40, 41, 42].
Some methods use uncertainty-based losses to improve their prediction training [33, 43] or take it as input to increase robustness to perception errors [44, 45], and a few apply it to predict distributional shift [10, 11]. But so far, apart from replacing high uncertainty cases with ground truth [6] for evaluation, little work has been done on how to actually leverage this uncertainty.
Recently, more reflection has been carried out on the ways of evaluating these trajectory prediction methods. Some argue that motion estimation should be evaluated with regards to its downstream effect on the planner [46, 47, 48], while others focus on their lack of generalization to new scenarii [49]. Similar cross-datasets studies have been conducted for fields related to autonomous driving such as human intention [50] or detection [51].
3 Cross-dataset analysis in trajectory prediction
In this first part of the paper, we focus on analyzing the cross-dataset performance of recent state-of-the-art trajectory prediction methods. We first define the trajectory prediction task and present two recent trajectory prediction methods that attack the problem from different perspectives. Subsequently, we describe the datasets we use in the analysis and finally we present the cross-dataset performance of both prediction methods.
3.1 Task definition
Given a target agent, its past history and its surrounding context which consists of the neighbor agents and the road graph, the goal of a trajectory prediction model is to predict the future trajectory of the target agent up to a time horizon . More precisely, we will simplify here the trajectory prediction problem to predicting the final destination point at the end of the prediction horizon , as commonly done in [27, 29, 36, 38]. As the future is uncertain and can contain multiple possibilities, the prediction model needs to be multimodal and predict up to k=6 trajectory modalities, with matching probabilities.
3.2 Trajectory prediction methods
In order to be representative of the wide scope of existing trajectory prediction methods, we implement two state-of-the-art baselines both representative of the different possibilities for output formulation, i.e. scalar coordinates output or probability heatmap output.
3.2.1 SceneTransformer
SceneTransformer [33] is one of the most recent trajectory prediction model regressing multiple scalar trajectories using a transform architecture. In its encoding phase, it retains the time dimension across all agents present in the scene, and applies factorized self-attention either across agents or time, as well as cross-attention onto the map context. It uses modality one-hot embeddings and a transformer decoder to predict multiple modalities, so that it can share the decoding weights of the multiple futures that are training using a Winner-Take-All loss as in most scalar output methods [12, 26, 13, 14, 43].
We reimplement a similar architecture with the same number of layers as in the original paper but with a smaller hidden dimension D=128 to make it fit on a single GPU and be more comparable to our second baseline in parameter size and training time.
3.2.2 GOHOME
GOHOME [37] is part of a growing class of methods using occupancy grids [39, 40, 34, 35, 52, 53, 36, 54, 38, 55, 41, 42]. The occupancy grid usually represents a probability distribution in the form of a heatmap describing the possible future locations of the vehicle at the end of the prediction horizon . Given the predicted heatmap, a set of final future positions is sampled. In a final step, for each sampled locations, the full trajectory is regressed [37]. In order to sample the possible future locations from the heatmap, usually a Non-Maximum Suppression (NMS) method is applied [38, 36, 41]. This NMS requires a sampling radius parameter to determine how far apart the sampled endpoints should be from each other.
We apply some slight modifications to the GOHOME architecture to adapt it to our case analysis. First, since some datasets don’t provide connectivity information between lanes [6], we replace the graph convolutions with global attention, in a VectorNet-like manner as in [38, 33, 11]. We also replace the lane-based heatmap decoder with the hierarchical sparse grid decoder from [55] for faster inference and once again independence from the HD-Map connectivity information
3.3 Datasets and Metrics
We evaluate performance on the widely used trajectory datasets Argoverse [8], Interaction [7], NuScenes [9] and Shifts [6], all focusing on car trajectories. These benchmarks have slightly different initial settings as described in Tab. 1. Namely, the history and prediction horizons are not always the same, and can be sampled at different rates. For fair evaluation and transferability, we standardize these datasets to always use 1s of history and predict 3s in the future. We also interpolate the trajectories to resample them at 10Hz each.
| Dataset | Argoverse | Interaction | NuScenes | Shifts |
|---|---|---|---|---|
| History (s) | 2 | 1 | 2 | 5 |
| Prediction horizon (s) | 3 | 3 | 6 | 5 |
| Frequency (Hz) | 10 | 10 | 2 | 5 |
| Training size | 200k | 400k | 30k | 5M |
In our analysis we consider the well established multimodal metrics minFDEl and MRl [7, 8]. minFDEl represents the minimum final displacement error at time horizon over the top-ranked trajectories. MRl represents the percentage of samples in the dataset on which the ground truth future position of the target agent at time horizon is farther than 2m from any of the top-ranked predicted trajectories.
3.4 Cross-dataset evaluation
We analyze here the trajectory prediction performance of both models presented in section 3.2 when they are trained on the training split of one dataset and tested on the validation splits of all datasets.
3.4.1 Training details
We trained each model for 50 epochs of 2000 iterations each, with a batch size of 64. The GOHOME hyper-parameter related to the sampling radius has been optimized on the training-split of the training dataset and kept unchanged for the test datasets. Few data augmentation schemes were employed to optimize the generalizability performance. First, all models are trained with random rotations to prevent overfitting on the current car heading measurement. Furthermore, we noticed that the Argoverse dataset does not present any case where the target agent to be predicted has a speed lower than 1 m/s. Contrarily, other datasets include vehicles to be predicted that stand still or with very low speed values for the whole prediction horizon. For this reason, it has been necessary to augment the Argoverse dataset with prediction samples related to vehicles present in the scenes that move slowly or are parked other than the predefined target. Without this augmentation procedure, models trained on the plain Argoverse ends up with poor generalization performance on other datasets.
3.4.2 Results
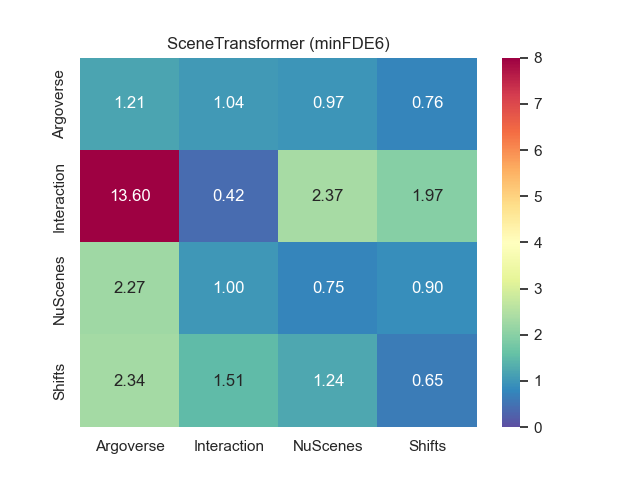
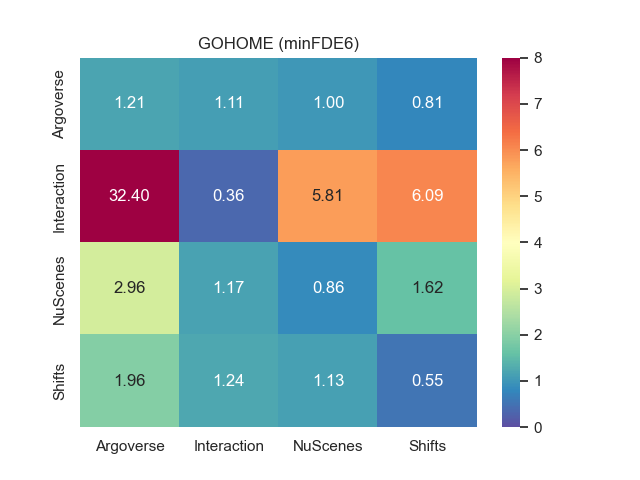
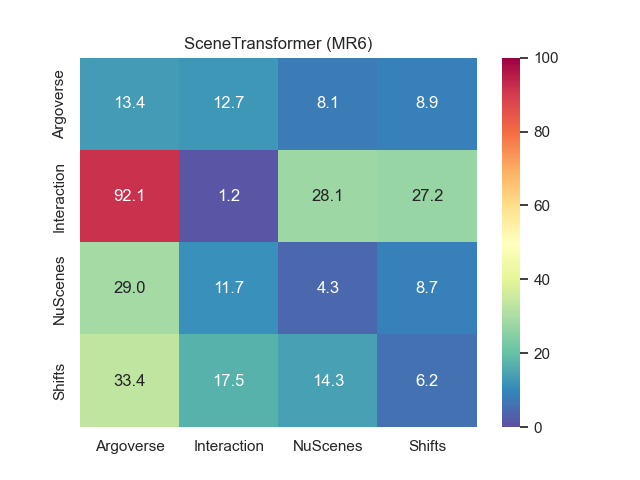
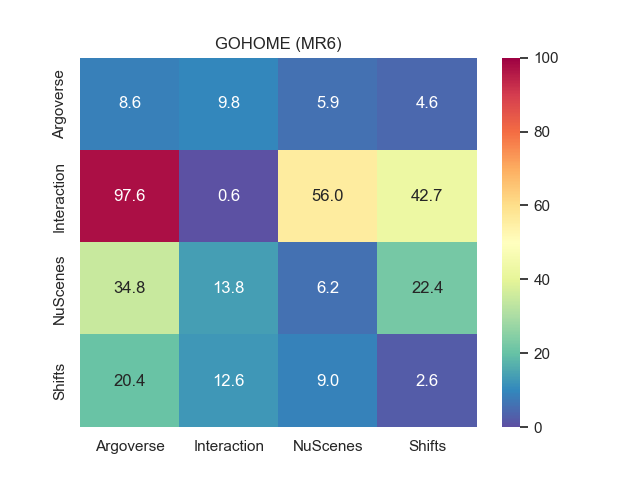
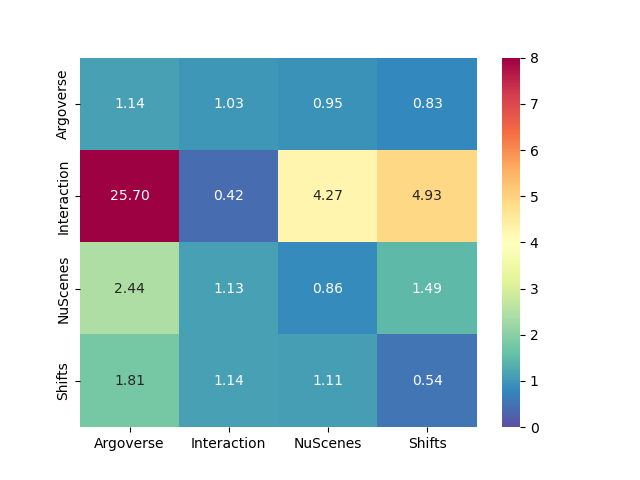
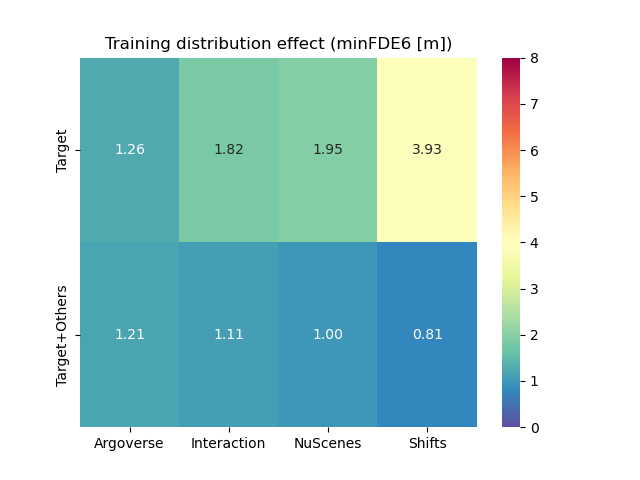
We report onto Fig. 1 the cross-dataset performance matrices for minFDE6 and MR6 for both prediction models. The label on the rows indicates the dataset used for training while the label on the columns represent the target test datasets. The numbers in the matrix corresponds to the performance measured on the validation split of the corresponding target dataset. As expected, the best performance are visible on the diagonals, since both models perform better when tested on data coming from the same distribution of the training.
We observe that Argoverse training exhibits the smallest loss of performance when tested on other datasets. We also observe that despite its relatively short size (only 30k samples), the training on NuScenes also performs reasonably on other datasets, whereas when trained on Interaction, the models performs poorly on every other domain. We attribute the poor performance of Interaction to its different data collection and processing, done with top-view images from drones instead of the usual perception pipeline from the autonomous vehicle. Therefore Interaction is trained on an almost perfect object detection and tracking, and does poorly on other datasets filled with detection inaccuracies and tracking jumps caused by occlusions. Surprisingly, despite its superior sample size, training on Shifts doesn’t provide better transferability performance compared Argoverse and NuScenes.
In order to assess ideal cross-dataset performance, for completeness we also present the results that are obtained when training the models on all the available datasets at the same time. To achieve this, each sample loaded during training is drawn randomly from one of the 4 datasets, with equal probability. The reader is referred to the supplementary material for this analysis.
The main first conclusion we can draw from this cross-dataset performance is that it is not so much the size of the data that matters, rather than its ability to faithfully represent real conditions.
When comparing the performance between the heatmap-based and the scalar-based models, we can notice how the heatmap output provides the best MR on the training datasets (with the exception of NuScenes) while scalar output provide the best minFDE. Regarding the transferability performance, SceneTransformer present the smallest performance loss compared to GOHOME when tested on other datasets.

4 Heatmap-Based Uncertainty estimation
In this section, we present a method to leverage the heatmap output formulation of models like GOHOME in order to estimate how much the model is uncertain when performing a trajectory prediction. We first present the formulation of the uncertainty estimation and in a second step we show how the uncertainty can be utilized to improve prediction performance.
4.1 Uncertainty formulation
The proposed uncertainty formulation is based on the fact that prediction methods designed to produce an heatmap provide a natural intrinsic uncertainty estimator in the spread of their output. We use the variance of the predicted spatial probability distribution as an indicator of the model uncertainty :
| (1) |
where we iterate over the positions of the heatmap and we indicate with the probability value for the given position. corresponds to the expected value of the probability distribution described by the heatmap. With this formulation, we claim that the heatmap provides for free an unconstrained and non-parametric measure of uncertainty without the need of adding and training a model part specific to uncertainty prediction as in [11] and [10].
4.2 Controlling prediction diversity with uncertainty
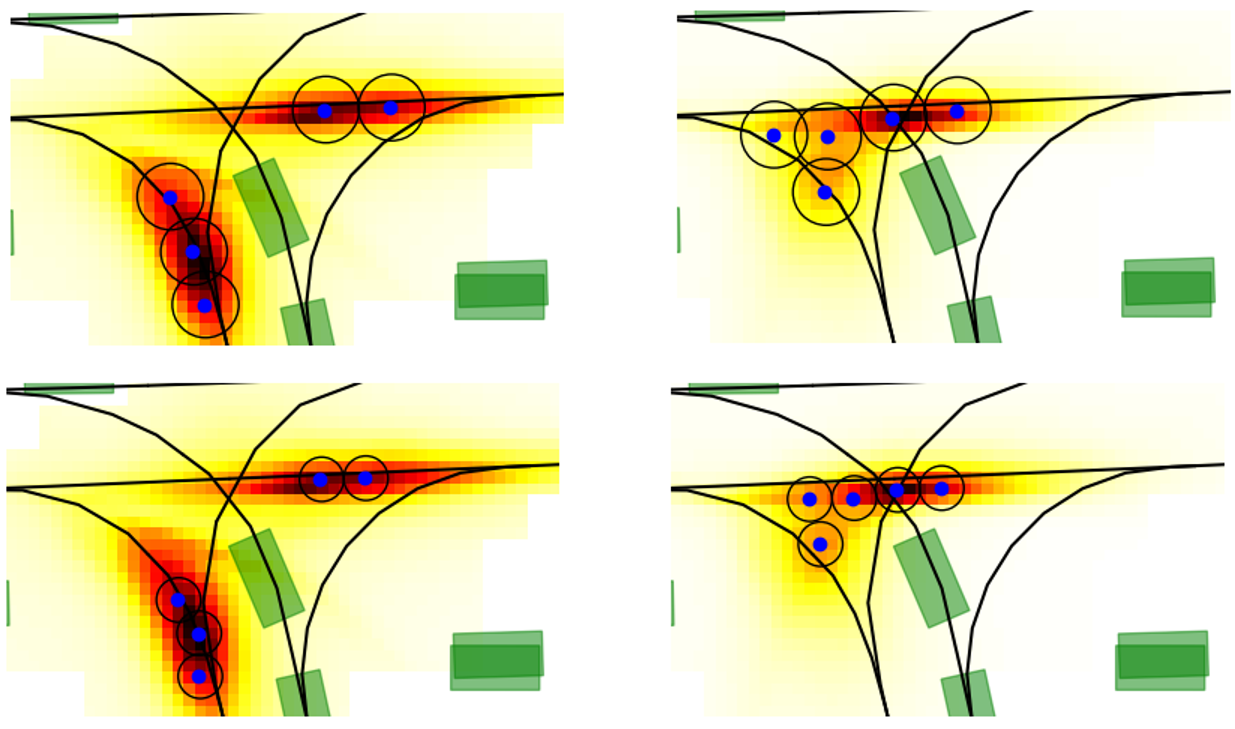
We leverage the presented uncertainty estimation to control the diversity of the predicted future locations at the prediction horizon . Intuitively, when the network is more uncertain, in order to minimize the prediction error it is required to increase the diversity of the predictions to cover a wider span of possibilities. In practice we control this behavior, by adapting the sampling radius presented in section 3.2.2 to adjust the diversity of the sampled locations to the spread of the heatmap. This behavior is depicted in Fig. 9 where a bigger sampling radius is employed on the left example to cope with a more uncertain prediction testified by the bigger spread in the heatmap.
4.3 Results
4.3.1 Uncertainty as prediction error estimator
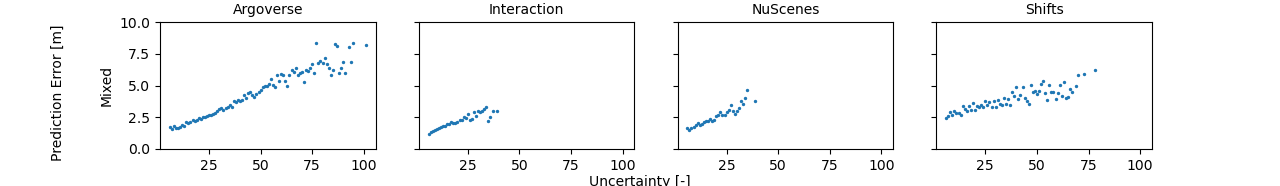
To motivate our uncertainty definition, we first show how the uncertainty estimated through Equation 1 is correlated with the prediction error that the model ends up making. Figure 3 shows the average prediction error minFDE1 of the GOHOME model for uncertainty values grouped into integer bins. In the case of GOHOME, minFDE1 represents the error made by a single prediction on the most probable location highlighted by the heatmap. The prediction error is calculated on the validation split of each dataset in consideration. We can clearly see a strong correlation between uncertainty and prediction error testifying that heatmap based methods intrinsically carry a notion of their performance when making a prediction inference. It is interesting to notice how a similar trend is mantained even when the analysis is done cross-dataset, i.e. when the model is evaluated on a dataset different from the training dataset.

4.3.2 Uncertainty enhanced cross-dataset performance
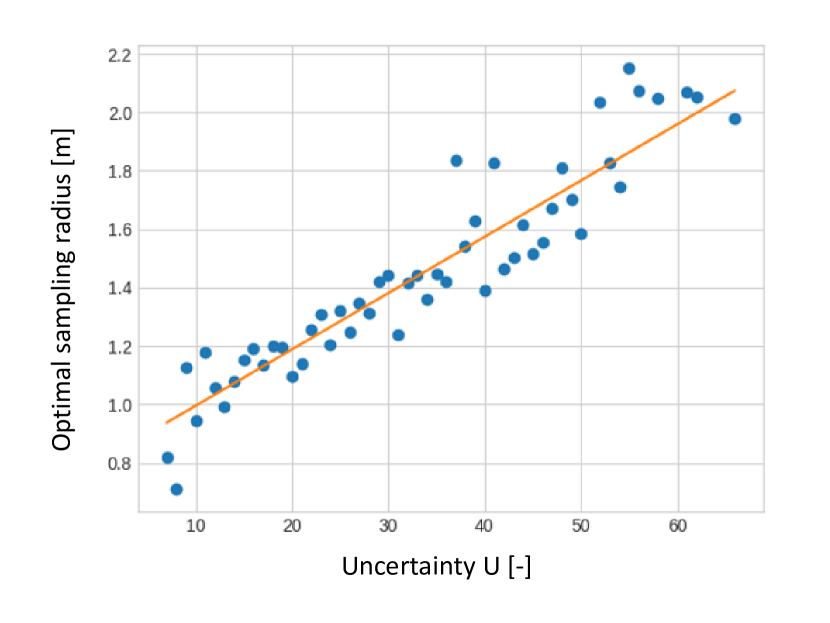
In this section we show the benefit of using the presented uncertainty to adapt the diversity of the predicted locations through the sampling radius . First, we experimentally show that the optimal sampling radius that minimize the prediction error follows a linear trend with respect the estimated uncertainty. Figure 9 depicts the average optimal sampling radius calculated over the Argoverse dataset versus the estimated uncertainty grouped in bins of integer values. The reader is invited to check the supplementary materials for the plots on other datasets.
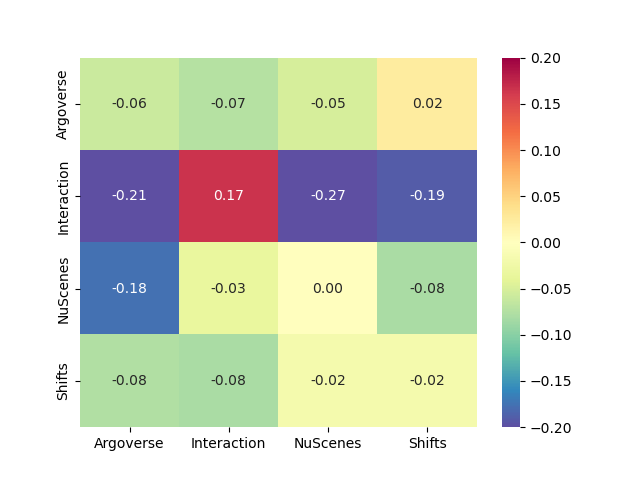
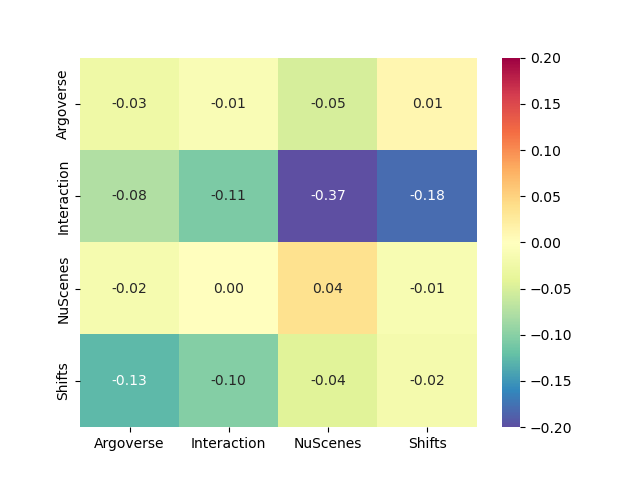
Furthermore, we report cross-datasets results using an adaptive sampling radius to adjust the prediction diversity depending on uncertainty. Left image in Fig. 4 shows the minFDE6 cross-dataset performance when the model is trained on the dataset denoted in the row label and evaluated on the datasets denoted by the column label. In each one of this experiment the radius is adapted following the linear model calibrated on the dataset used for training and kept unchanged for evaluation on target datasets. We can see in the middle image of 4 how the adaptive sampling strategy is significantly better in almost all cases compared to the constant radius sampling presented in Fig. 1.
We benchmark our method of computing the prediction uncertainty by comparing it to a learned variance of a Gaussian distribution as in [56, 57, 33, 58]. As in [56] we directly predict for numerical stability with the following loss:
| (2) |
We report on the right image of Fig. 4, the improvement in minFDE6 when using our uncertanty definition of Equation 1 compared with the learned baseline of Equation 2 to adapt the sampling radius. While it yields similar results on the same train-test diagonal, the learned uncertainty tends to overfit on its training data and doesn’t perform as well on out-of-distribution data. We display qualitative prediction examples in Fig. 5. Each line is an example sample of one dataset, and each column the prediction result of the model trained on the corresponding dataset. We also report uncertainty numbers for each sample to observe how uncertainty matches the heatmap spread and the resulting adapted endpoint sampling

5 Conclusion
In this work we have done the first cross-dataset analysis in the field of vehicle trajectory prediction for autonomous driving. We have analyzed the cross-dataset transferability performance of two state of the art trajectory prediction model. We have also proposed a new way to estimate uncertainty for heatmap-based trajectory prediction methods that doesn’t require any further training and works better than classically learned uncertainties. We showed how using the uncertainty boost trajectory prediction performance of heatmap-based methods in a cross-dataset setting.
6 Weaknesses
This analysis has been limited to car trajectory prediction, a similar analyses across different type of traffic participants such as bicycles and pedestrians would also be of interest. Furhermore, while this study demonstrates that the use of heatmap variance for uncertainty estimation and sampling radius adaptation brings a significant performance improvement to heatmap output methods, the comparison to scalar outputs methods like SceneTransformer shows a less clear trend. The heatmap base method enriched with uncertainty has similar transferability performance to SceneTransformer. SceneTransformer is trained end-to-end to directly predict a set of multimodal coordinates and somehow internally learns to adapt the diversity of the predictions without explicitly outputting an uncertainty value. On the other hand we strongly believe that having an explicit uncertainty output can be useful also for other downstream tasks in the autonomous driving stack.
References
- Liu et al. [2021] J. Liu, X. Mao, Y. Fang, D. Zhu, and M. Q.-H. Meng. A survey on deep-learning approaches for vehicle trajectory prediction in autonomous driving. arXiv preprint arXiv:2110.10436, 2021.
- Gomes and Wolf [2022] I. Gomes and D. Wolf. A review on intention-aware and interaction-aware trajectory prediction for autonomous vehicles. 2022.
- Karle et al. [2022] P. Karle, M. Geisslinger, J. Betz, and M. Lienkamp. Scenario understanding and motion prediction for autonomous vehicles-review and comparison. IEEE Transactions on Intelligent Transportation Systems, 2022.
- Jouaber et al. [2021] S. Jouaber, S. Bonnabel, S. Velasco-Forero, and M. Pilte. Nnakf: A neural network adapted kalman filter for target tracking. In ICASSP 2021-2021 IEEE International Conference on Acoustics, Speech and Signal Processing (ICASSP), pages 4075–4079. IEEE, 2021.
- Mercat [2021] J. Mercat. Motion forecasting of the objects in road scenes. PhD thesis, Université Paris-Saclay, 2021.
- Malinin et al. [2021] A. Malinin, N. Band, G. Chesnokov, Y. Gal, M. J. Gales, A. Noskov, A. Ploskonosov, L. Prokhorenkova, I. Provilkov, V. Raina, et al. Shifts: A dataset of real distributional shift across multiple large-scale tasks. arXiv preprint arXiv:2107.07455, 2021.
- Zhan et al. [2019] W. Zhan, L. Sun, D. Wang, H. Shi, A. Clausse, M. Naumann, J. Kummerle, H. Konigshof, C. Stiller, A. de La Fortelle, et al. Interaction dataset: An international, adversarial and cooperative motion dataset in interactive driving scenarios with semantic maps. arXiv:1910.03088, 2019.
- Chang et al. [2019] M.-F. Chang, J. Lambert, P. Sangkloy, J. Singh, S. Bak, A. Hartnett, D. Wang, P. Carr, S. Lucey, D. Ramanan, et al. Argoverse: 3d tracking and forecasting with rich maps. In CVPR, 2019.
- Caesar et al. [2020] H. Caesar, V. Bankiti, A. H. Lang, S. Vora, V. E. Liong, Q. Xu, A. Krishnan, Y. Pan, G. Baldan, and O. Beijbom. nuscenes: A multimodal dataset for autonomous driving. In CVPR, 2020.
- Postnikov et al. [2021] A. Postnikov, A. Gamayunov, and G. Ferrer. Transformer based trajectory prediction. arXiv preprint arXiv:2112.04350, 2021.
- Pustynnikov and Eremeev [2021] A. Pustynnikov and D. Eremeev. Estimating uncertainty for vehicle motion prediction on yandex shifts dataset. arXiv preprint arXiv:2112.08355, 2021.
- Cui et al. [2019] H. Cui, V. Radosavljevic, F.-C. Chou, T.-H. Lin, T. Nguyen, T.-K. Huang, J. Schneider, and N. Djuric. Multimodal trajectory predictions for autonomous driving using deep convolutional networks. In ICRA, 2019.
- Liang et al. [2020] M. Liang, B. Yang, R. Hu, Y. Chen, R. Liao, S. Feng, and R. Urtasun. Learning lane graph representations for motion forecasting. In ECCV, 2020.
- Narayanan et al. [2021] S. Narayanan, R. Moslemi, F. Pittaluga, B. Liu, and M. Chandraker. Divide-and-conquer for lane-aware diverse trajectory prediction. In Proceedings of the IEEE/CVF Conference on Computer Vision and Pattern Recognition, pages 15799–15808, 2021.
- Deo and Trivedi [2018] N. Deo and M. M. Trivedi. Convolutional social pooling for vehicle trajectory prediction. In CVPR, 2018.
- Mercat et al. [2020] J. Mercat, T. Gilles, N. El Zoghby, G. Sandou, D. Beauvois, and G. P. Gil. Multi-head attention for multi-modal joint vehicle motion forecasting. In ICRA, 2020.
- Lee et al. [2017] N. Lee, W. Choi, P. Vernaza, C. B. Choy, P. H. Torr, and M. Chandraker. Desire: Distant future prediction in dynamic scenes with interacting agents. In CVPR, 2017.
- Rhinehart et al. [2018] N. Rhinehart, K. M. Kitani, and P. Vernaza. R2p2: A reparameterized pushforward policy for diverse, precise generative path forecasting. In ECCV, 2018.
- Tang and Salakhutdinov [2019] Y. C. Tang and R. Salakhutdinov. Multiple futures prediction. In NeurIPS, 2019.
- Mangalam et al. [2020] K. Mangalam, H. Girase, S. Agarwal, K.-H. Lee, E. Adeli, J. Malik, and A. Gaidon. It is not the journey but the destination: Endpoint conditioned trajectory prediction. In ECCV, 2020.
- Salzmann et al. [2020] T. Salzmann, B. Ivanovic, P. Chakravarty, and M. Pavone. Trajectron++: Dynamically-feasible trajectory forecasting with heterogeneous data. In ECCV, 2020.
- Alahi et al. [2016] A. Alahi, K. Goel, V. Ramanathan, A. Robicquet, L. Fei-Fei, and S. Savarese. Social lstm: Human trajectory prediction in crowded spaces. In CVPR, 2016.
- Sadeghian et al. [2019] A. Sadeghian, V. Kosaraju, A. Sadeghian, N. Hirose, H. Rezatofighi, and S. Savarese. Sophie: An attentive gan for predicting paths compliant to social and physical constraints. In CVPR, 2019.
- Casas et al. [2020] S. Casas, C. Gulino, S. Suo, K. Luo, R. Liao, and R. Urtasun. Implicit latent variable model for scene-consistent motion forecasting. In ECCV, 2020.
- Phan-Minh et al. [2020] T. Phan-Minh, E. C. Grigore, F. A. Boulton, O. Beijbom, and E. M. Wolff. Covernet: Multimodal behavior prediction using trajectory sets. In CVPR, 2020.
- Chai et al. [2020] Y. Chai, B. Sapp, M. Bansal, and D. Anguelov. Multipath: Multiple probabilistic anchor trajectory hypotheses for behavior prediction. In CoRL, 2020.
- Zhao et al. [2020] H. Zhao, J. Gao, T. Lan, C. Sun, B. Sapp, B. Varadarajan, Y. Shen, Y. Shen, Y. Chai, C. Schmid, et al. Tnt: Target-driven trajectory prediction. CoRL, 2020.
- Zhang et al. [2020] L. Zhang, P.-H. Su, J. Hoang, G. C. Haynes, and M. Marchetti-Bowick. Map-adaptive goal-based trajectory prediction. In CoRL, 2020.
- Zeng et al. [2021] W. Zeng, M. Liang, R. Liao, and R. Urtasun. Lanercnn: Distributed representations for graph-centric motion forecasting. In IROS, 2021.
- Deo et al. [2021] N. Deo, E. M. Wolff, and O. Beijbom. Multimodal trajectory prediction conditioned on lane-graph traversals. In CoRL, 2021.
- Yuan et al. [2021] Y. Yuan, X. Weng, Y. Ou, and K. Kitani. Agentformer: Agent-aware transformers for socio-temporal multi-agent forecasting. arXiv:2103.14023, 2021.
- Girgis et al. [2022] R. Girgis, F. Golemo, F. Codevilla, M. Weiss, J. A. D’Souza, S. E. Kahou, F. Heide, and C. Pal. Latent variable sequential set transformers for joint multi-agent motion prediction. In International Conference on Learning Representations, 2022.
- Ngiam et al. [2021] J. Ngiam, B. Caine, V. Vasudevan, Z. Zhang, H.-T. L. Chiang, J. Ling, R. Roelofs, A. Bewley, C. Liu, A. Venugopal, et al. Scene transformer: A unified multi-task model for behavior prediction and planning. arXiv:2106.08417, 2021.
- Hong et al. [2019] J. Hong, B. Sapp, and J. Philbin. Rules of the road: Predicting driving behavior with a convolutional model of semantic interactions. In CVPR, 2019.
- Kurbiel et al. [2020] T. Kurbiel, A. Sachdeva, K. Zhao, and M. Buehren. Prognosenet: A generative probabilistic framework for multimodal position prediction given context information. arXiv preprint arXiv:2010.00802, 2020.
- Gilles et al. [2021a] T. Gilles, S. Sabatini, D. Tsishkou, B. Stanciulescu, and F. Moutarde. Home: Heatmap output for future motion estimation. In ITSC, 2021a.
- Gilles et al. [2021b] T. Gilles, S. Sabatini, D. Tsishkou, B. Stanciulescu, and F. Moutarde. Gohome: Graph-oriented heatmap output forfuture motion estimation. arXiv preprint arXiv:2108.09640, 2021b.
- Gu et al. [2021] J. Gu, C. Sun, and H. Zhao. Densetnt: End-to-end trajectory prediction from dense goal sets. In ICCV, 2021.
- Kim et al. [2017] B. Kim, C. M. Kang, J. Kim, S. H. Lee, C. C. Chung, and J. W. Choi. Probabilistic vehicle trajectory prediction over occupancy grid map via recurrent neural network. In 2017 IEEE 20th International Conference on Intelligent Transportation Systems (ITSC), pages 399–404. IEEE, 2017.
- Park et al. [2018] S. H. Park, B. Kim, C. M. Kang, C. C. Chung, and J. W. Choi. Sequence-to-sequence prediction of vehicle trajectory via lstm encoder-decoder architecture. In 2018 IEEE Intelligent Vehicles Symposium (IV), pages 1672–1678. IEEE, 2018.
- Schäfer et al. [2022] M. Schäfer, K. Zhao, M. Bühren, and A. Kummert. Context-aware scene prediction network (caspnet). arXiv preprint arXiv:2201.06933, 2022.
- Mahjourian et al. [2022] R. Mahjourian, J. Kim, Y. Chai, M. Tan, B. Sapp, and D. Anguelov. Occupancy flow fields for motion forecasting in autonomous driving. IEEE Robotics and Automation Letters, 2022.
- Varadarajan et al. [2021] B. Varadarajan, A. Hefny, A. Srivastava, K. S. Refaat, N. Nayakanti, A. Cornman, K. Chen, B. Douillard, C. P. Lam, D. Anguelov, et al. Multipath++: Efficient information fusion and trajectory aggregation for behavior prediction. arXiv preprint arXiv:2111.14973, 2021.
- Weng et al. [2021] X. Weng, B. Ivanovic, and M. Pavone. Mtp: Multi-hypothesis tracking and prediction for reduced error propagation. arXiv preprint arXiv:2110.09481, 2021.
- Ivanovic et al. [2022] B. Ivanovic, Y. Lin, S. Shrivastava, P. Chakravarty, and M. Pavone. Propagating state uncertainty through trajectory forecasting. In ICRA, 2022.
- Ivanovic and Pavone [2021a] B. Ivanovic and M. Pavone. Rethinking trajectory forecasting evaluation. arXiv preprint arXiv:2107.10297, 2021a.
- Ivanovic and Pavone [2021b] B. Ivanovic and M. Pavone. Injecting planning-awareness into prediction and detection evaluation. arXiv preprint arXiv:2110.03270, 2021b.
- McAllister et al. [2022] R. McAllister, B. Wulfe, J. Mercat, L. Ellis, S. Levine, and A. Gaidon. Control-aware prediction objectives for autonomous driving. arXiv preprint arXiv:2204.13319, 2022.
- Bahari et al. [2022] M. Bahari, S. Saadatnejad, A. Rahimi, M. Shaverdikondori, A. H. Shahidzadeh, S.-M. Moosavi-Dezfooli, and A. Alahi. Vehicle trajectory prediction works, but not everywhere. In Proceedings of the IEEE/CVF Conference on Computer Vision and Pattern Recognition, pages 17123–17133, 2022.
- Gesnouin et al. [2022] J. Gesnouin, S. Pechberti, B. Stanciulescu, and F. Moutarde. Assessing cross-dataset generalization of pedestrian crossing predictors. arXiv preprint arXiv:2201.12626, 2022.
- Hasan et al. [2022] I. Hasan, S. Liao, J. Li, S. U. Akram, and L. Shao. Pedestrian detection: Domain generalization, cnns, transformers and beyond. arXiv preprint arXiv:2201.03176, 2022.
- Ridel et al. [2020] D. Ridel, N. Deo, D. Wolf, and M. Trivedi. Scene compliant trajectory forecast with agent-centric spatio-temporal grids. IEEE Robotics and Automation Letters, 2020.
- Mangalam et al. [2020] K. Mangalam, Y. An, H. Girase, and J. Malik. From goals, waypoints & paths to long term human trajectory forecasting. arXiv:2012.01526, 2020.
- Casas et al. [2021] S. Casas, A. Sadat, and R. Urtasun. Mp3: A unified model to map, perceive, predict and plan. In Proceedings of the IEEE/CVF Conference on Computer Vision and Pattern Recognition, pages 14403–14412, 2021.
- Gilles et al. [2022] T. Gilles, S. Sabatini, D. Tsishkou, B. Stanciulescu, and F. Moutarde. Thomas: Trajectory heatmap output with learned multi-agent sampling. In ICLR, 2022.
- Kendall and Cipolla [2017] A. Kendall and R. Cipolla. Geometric loss functions for camera pose regression with deep learning. In Proceedings of the IEEE conference on computer vision and pattern recognition, pages 5974–5983, 2017.
- Meyer and Thakurdesai [2020] G. P. Meyer and N. Thakurdesai. Learning an uncertainty-aware object detector for autonomous driving. In 2020 IEEE/RSJ International Conference on Intelligent Robots and Systems (IROS), pages 10521–10527. IEEE, 2020.
- Moreau et al. [2022] A. Moreau, N. Piasco, D. Tsishkou, B. Stanciulescu, and A. de La Fortelle. Coordinet: uncertainty-aware pose regressor for reliable vehicle localization. In Proceedings of the IEEE/CVF Winter Conference on Applications of Computer Vision, pages 2229–2238, 2022.
Appendix A Comparison of data distribution between datasets and influence of data augmentation
A.1 Speed distribution
We mention in Sec. 3.4.1 the need to include non-target agents in the training data of Argoverse to correctly generalize to other datasets. We illustrate here this distributional gap in Fig. 6, where we display the average speed of the target agent during the future to be predicted. We can therefore observe than Argoverse has little to no agent that stay stationary, compared to other datasets
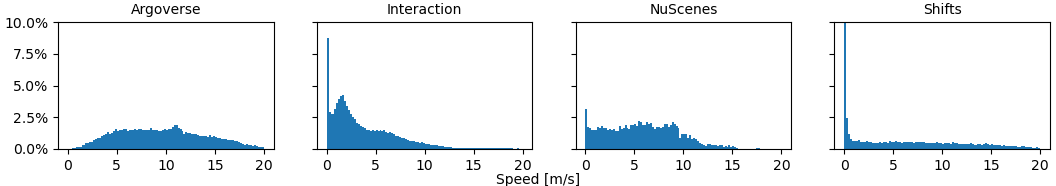
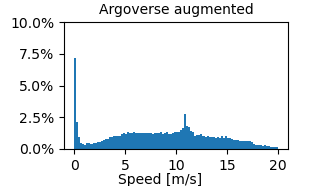
This leads to the performance gap observed in Fig. 7(a), where the model trained strictly on Argoverse has way higher errors on the other datasets, and notably on the Shifts dataset which has a very high proportion of stationary samples. However, when we include a random sampling of 30 of agents other than the predefined target, the resulting speed distribution reported in Fig. 7(b) is much more representative of lower speed cases, and transfers much better onto the other datasets without losing performance on Argoverse itself.
A.2 Noise distribution
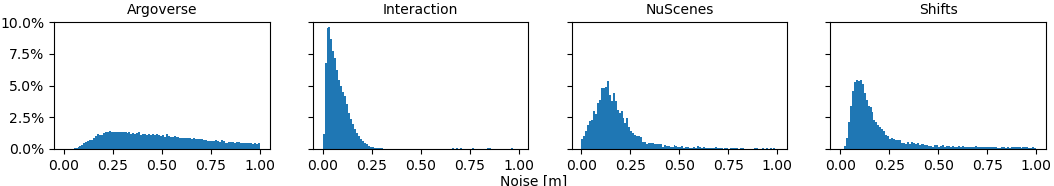
In order to estimate perception noise in each dataset, we filter each trajectory with a Kalman filter and report the maximum displacement between the raw trajectory and the filtered one. We report the resulting noise distribution in Fig. 8 and notice that the Interaction distribution is shifted towards lower noises than the other datasets, while Argoverse reaches higher noise values. These differences may explain the poor performance of the Interaction-trained model on other datasets.
Appendix B Adaptative radius for endpoint sampling
GOHOME outputs a heatmap estimating the probability distribution of the position of the target agent, onto which we apply a Non-maximum Suppression (NMS) method to sample the desired number of endpoint modalities. This NMS requires a sampling radius parameter to determine how far apart the sampled endpoints should be from each other. We illustrate in Fig. 9 the effect of this radius on the sampling.
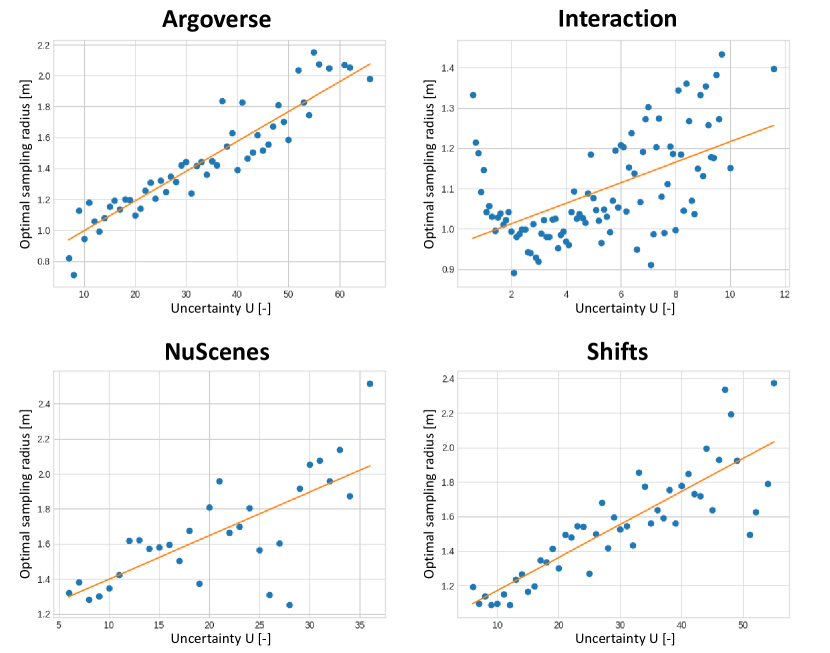
As seen in the Fig. 9 above, given a fixed number of future modalities, the distance between these future points should be adapted with regards to how spread the heatmap is, which correlates with the uncertainty of the model. We demonstrate this correlation further in Fig. 10, where we plot for each dataset, for the model trained on this dataset, the average optimal radius (according to the minFDE6 metric) for uncertainty values grouped into integer bins.
Fig. 10 highlights that this intuition for adaptive sampling is present on a per-sample scale, for most of the uncertainty values range. We therefore apply ordinary least squares to find regression coefficients between our estimated uncertainty and the optimal radius for a given case. The resulting curves are plotted in Fig. 10 and we report the resulting regression coefficients in Tab. 2, as well as the optimal fixed radii without adaptation for each dataset.
| Dataset | Argoverse | Interaction | NuScenes | Shifts |
|---|---|---|---|---|
| Radius | 1.5 | 0.6 | 1.1 | 1.5 |
| Affine | 0.020x+0.78 | 0.026x+0.96 | 0.014+1.32 | 0.022x+0.91 |
Appendix C Performance from training on all datasets
To get a better estimation of what ideal generalization cross-dataset performance would be, we train a model on all datasets at the same time, each sample being drawn from one of the dataset with equal 25 probability. We report in Tab. 3 the results of both GOHOME (with fixed or adaptive radius) and SceneTransformer models trained in this setting.
| Argoverse | Interaction | NuScenes | Shifts | |
|---|---|---|---|---|
| GOHOME (fixed r=1.5m) | 1.34 | 0.66 | 0.88 | 0.70 |
| GOHOME (adaptive radius) | 1.24 | 0.63 | 0.85 | 0.66 |
| SceneTransformer | 1.33 | 0.58 | 0.81 | 0.58 |
We show in Fig. 11 the average prediction error with regards to the predicted uncertainty per data point for the GOHOME model. Compared to the single-dataset trained models, we observe that, while having lower variance, the error curves show similar trends when trained on all datasets and reach similar ranges.
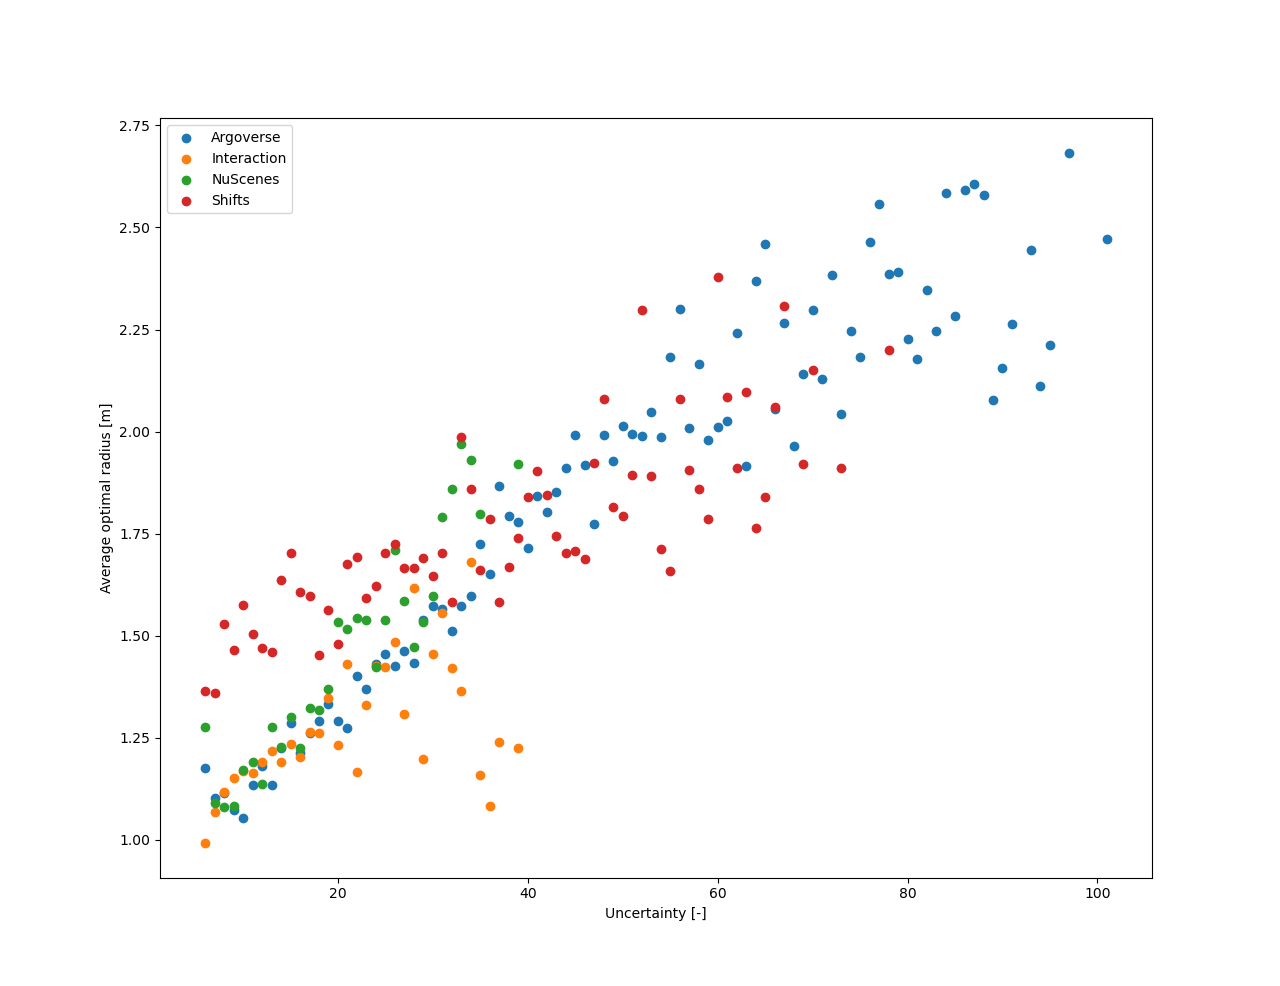
We also report the optimal sampling radius of the GOHOME model with regards to uncertainty in Fig. 12. We highlight the data points from different datasets in different colors, and notice that each dataset has slightly different ranges but similar linear correlation trends.
Appendix D Unsuccessful trials
Following the noise observations made in Sec. A.2, we tried to augment the training data on Interaction with synthetic perception noise to bridge the gap to the other datasets. We were however not able to gain any kind of significant performance this way. This failure may be due to the way we modelled perception noise (independent Gaussian noise at every timestep) that could be inappropriate, or to the fact that the performance gap is due to other factors other than input noise.
We also noticed a difference in speed distribution in Fig. 6 that reaches a lower upper limit (approx. 12.5 m/s) in Interaction compared to other datasets (although NuScenes also has a similarly limited distribution), and tried global random scaling to simulate higher speed, but this didn’t bring much improvement either.
We hypothesize that the remaining performance gap when training on Interaction may be due to overfitting on the limited number of maps, as Interaction has a discrete set of relatively small intersection maps compared to other dataset maps that scale closer to city sizes, but didn’t explore this hypothesis further.